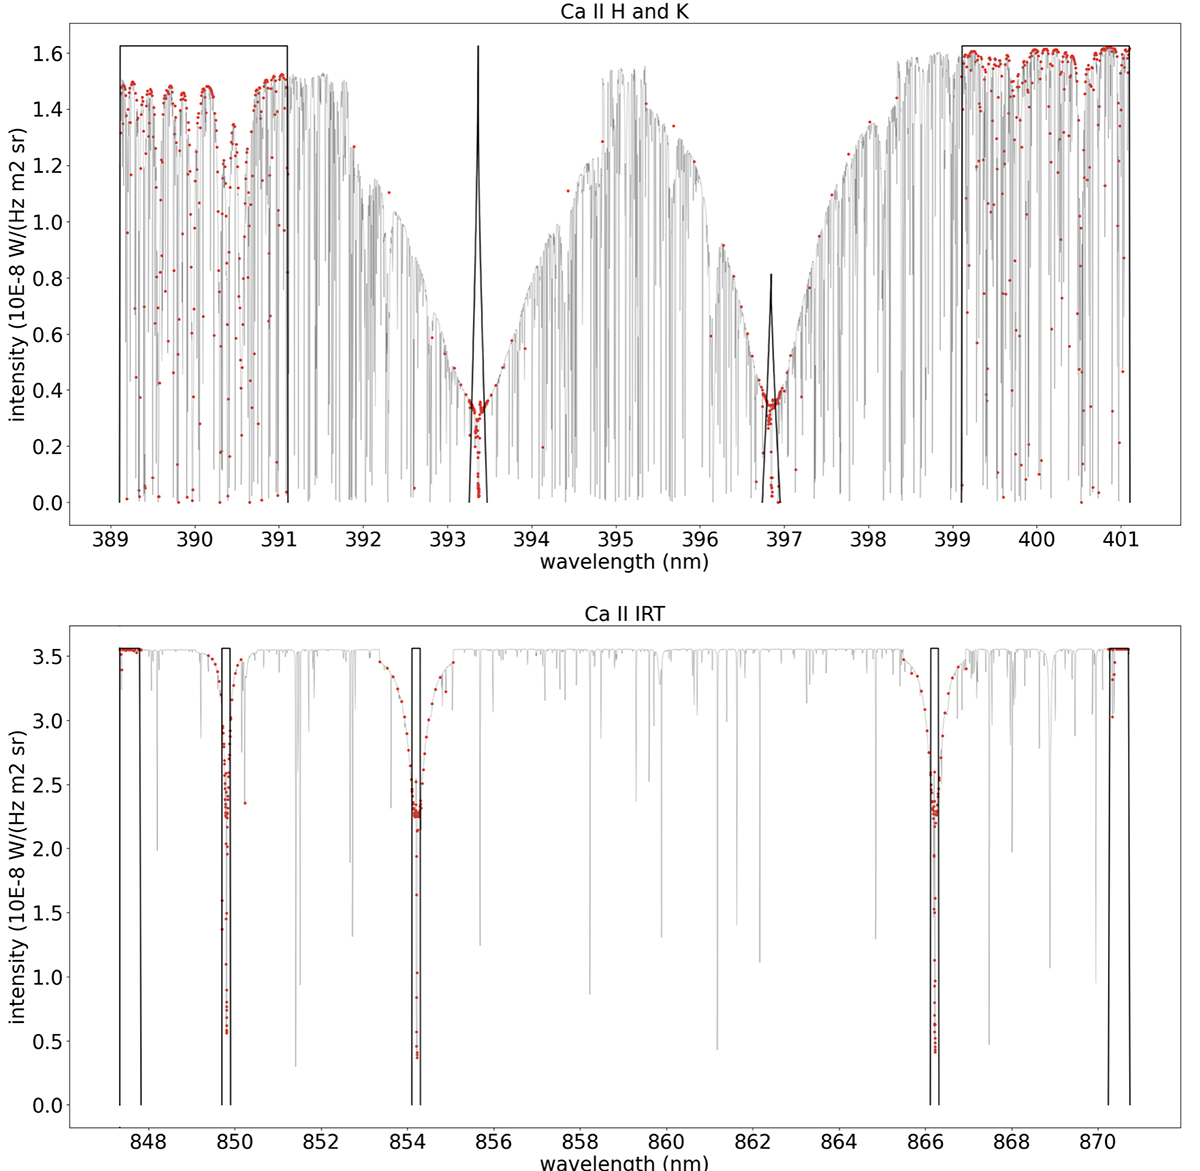
Fig. 2.
Download original image
Resolved spectra simulated with all Kurucz lines in the range 389.1067 nm to 401.1067 nm and 847.33 nm to 870.74 nm shown in black fine lines in comparison with the run considered in the study with comparatively fewer Kurucz lines shown in red dots for column (0, 0), the filters for the different bands required for calculating the indices are shown in thick black lines.
Current usage metrics show cumulative count of Article Views (full-text article views including HTML views, PDF and ePub downloads, according to the available data) and Abstracts Views on Vision4Press platform.
Data correspond to usage on the plateform after 2015. The current usage metrics is available 48-96 hours after online publication and is updated daily on week days.
Initial download of the metrics may take a while.