Open Access
Fig. A.2
Download original image
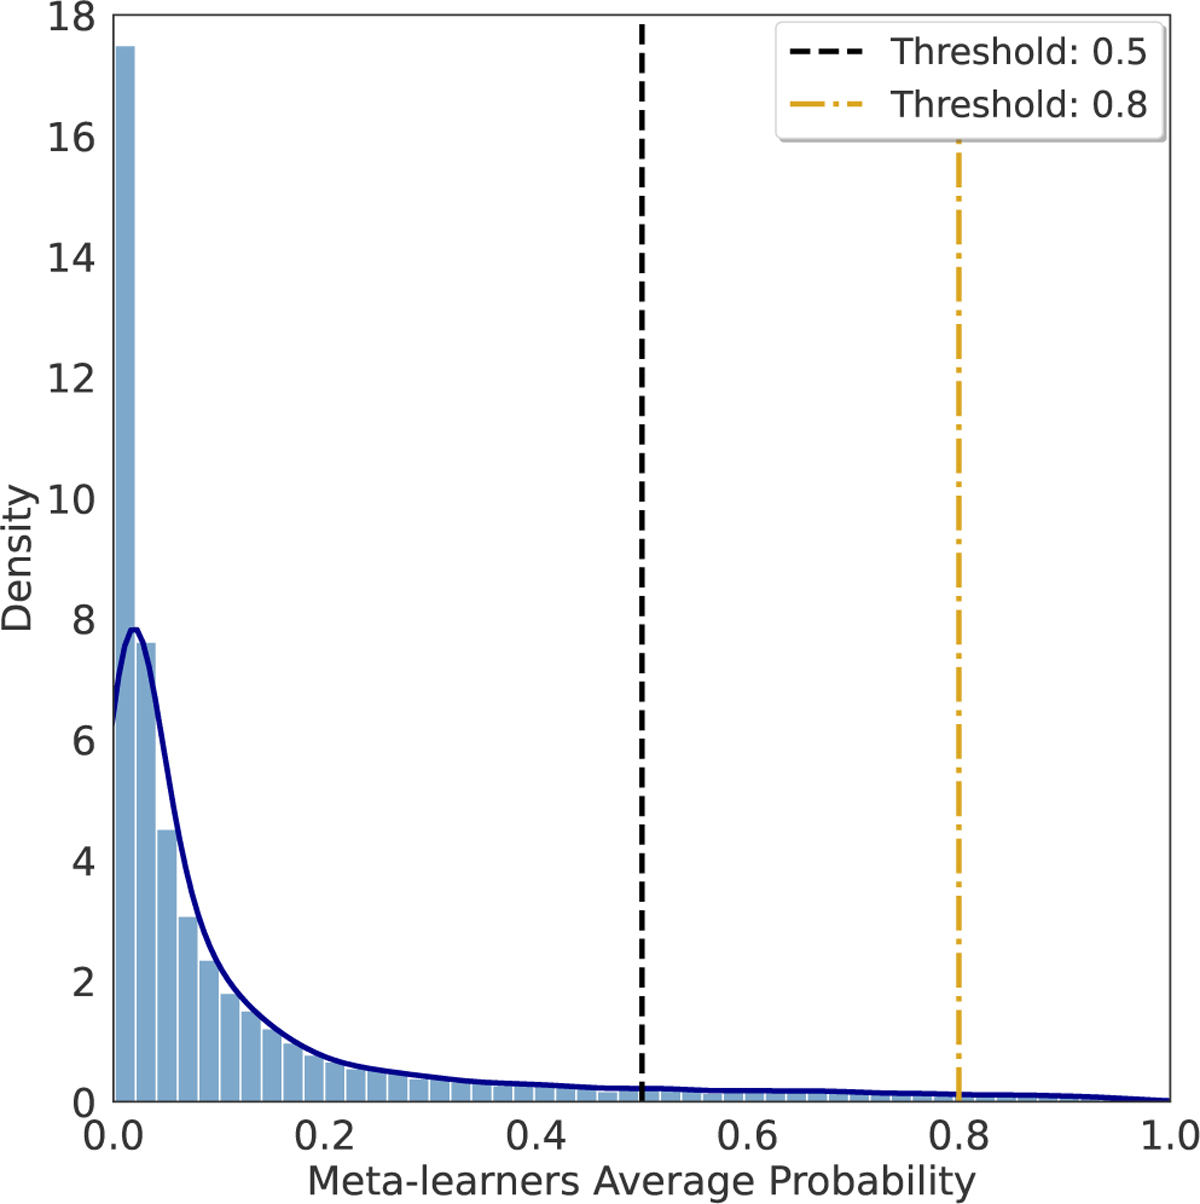
Histogram with the average probability predictions from the generalised stacking method with meta-learner correction. The black dashed line shows the ‘default value’, 0.5, and the yellow dashed line shows the chosen classification threshold in this study, 0.8.
Current usage metrics show cumulative count of Article Views (full-text article views including HTML views, PDF and ePub downloads, according to the available data) and Abstracts Views on Vision4Press platform.
Data correspond to usage on the plateform after 2015. The current usage metrics is available 48-96 hours after online publication and is updated daily on week days.
Initial download of the metrics may take a while.