Fig. 4
Download original image
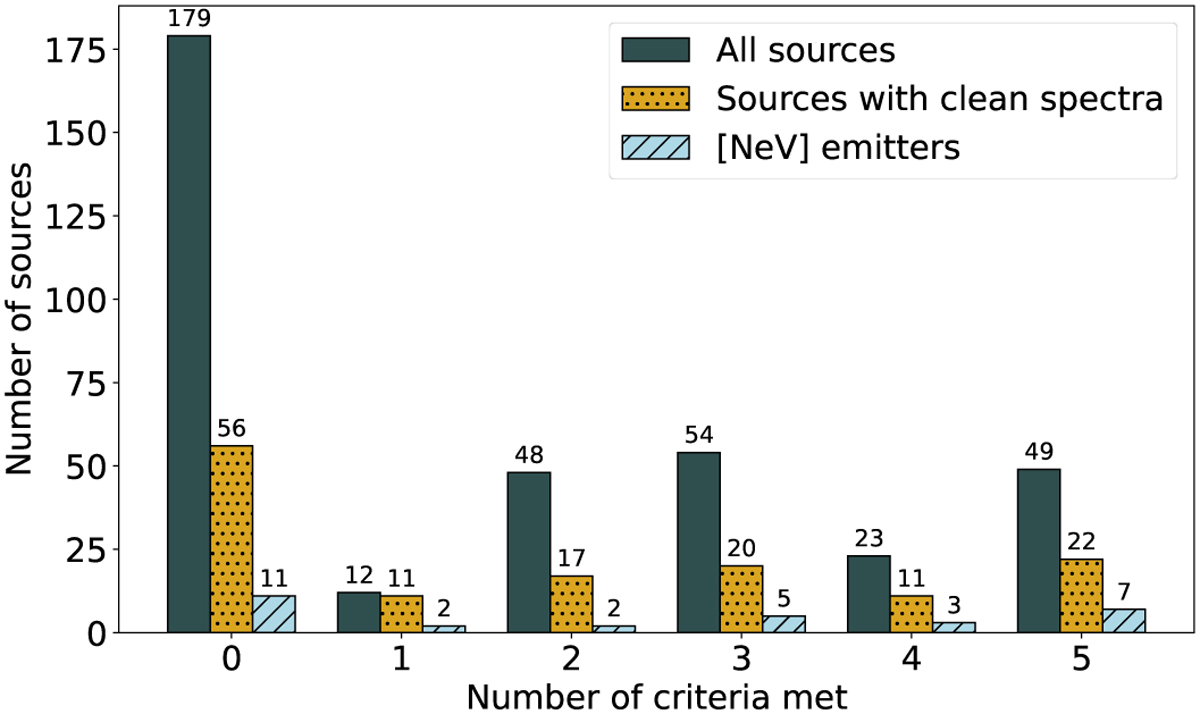
Bar plot illustrating the performance of the colour criteria in selecting AGN for the QSO2 candidates, as described in the studies by Stern et al. (2012); Mateos et al. (2012); Mingo et al. (2016); Blecha et al. (2018); Carvajal et al. (2023). Each bar represents a specific subset: (a) [NeV] emitters (30 sources), (b) sources with clean spectra (138 sources), and (c) all candidate sources (365 sources).
Current usage metrics show cumulative count of Article Views (full-text article views including HTML views, PDF and ePub downloads, according to the available data) and Abstracts Views on Vision4Press platform.
Data correspond to usage on the plateform after 2015. The current usage metrics is available 48-96 hours after online publication and is updated daily on week days.
Initial download of the metrics may take a while.