Fig. 1
Download original image
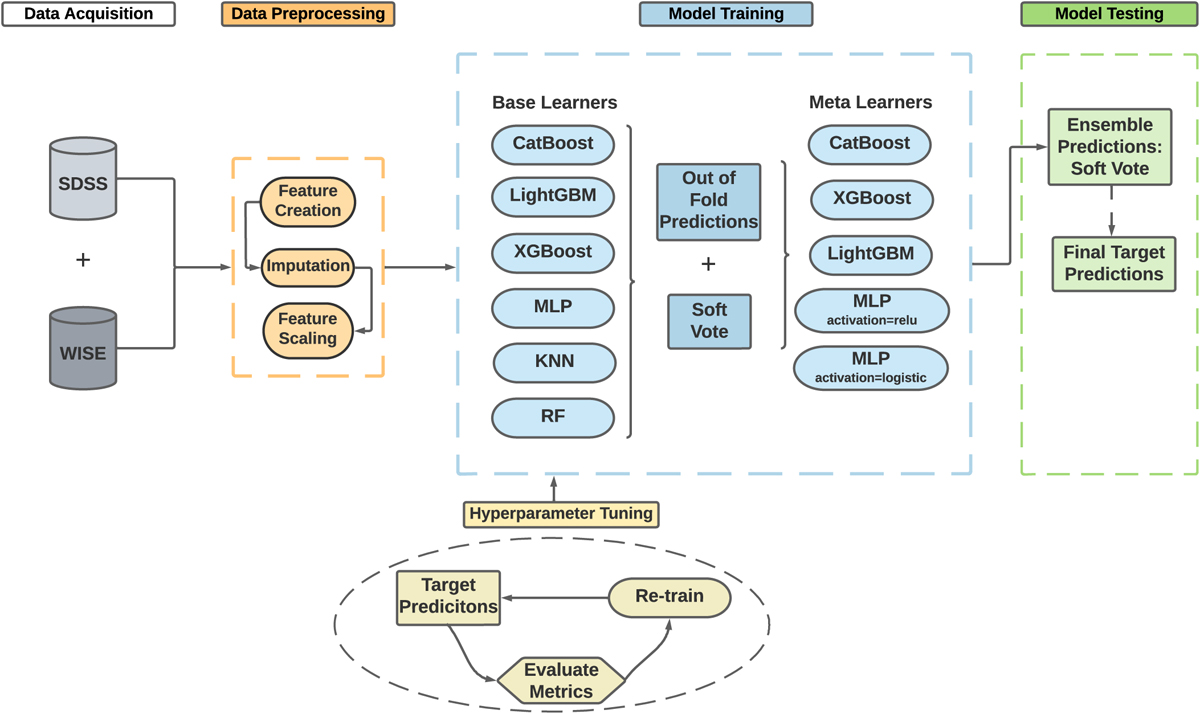
Flow diagram for the AMELIA pipeline. The process begins with the assembly of SDSS and WISE data. As seen in the orange box, feature creation is used to generate optical, optical-IR, and IR colours. The imputation method is applied to the training set and followed by feature scaling due to the use of different algorithms. The blue box shows a description of the model training procedures, but we recount them here as well: Each base learner is first loosely optimised for generalisation. Subsequently, out-of-fold predictions are combined with the average predictions from the base learners, utilising a soft-vote mechanism for the training of the meta-learners. The predictions from the meta-learners are then combined through ensembling, using a soft-vote fusion that results in the final predictions for the test set.
Current usage metrics show cumulative count of Article Views (full-text article views including HTML views, PDF and ePub downloads, according to the available data) and Abstracts Views on Vision4Press platform.
Data correspond to usage on the plateform after 2015. The current usage metrics is available 48-96 hours after online publication and is updated daily on week days.
Initial download of the metrics may take a while.