Fig. 8
Download original image
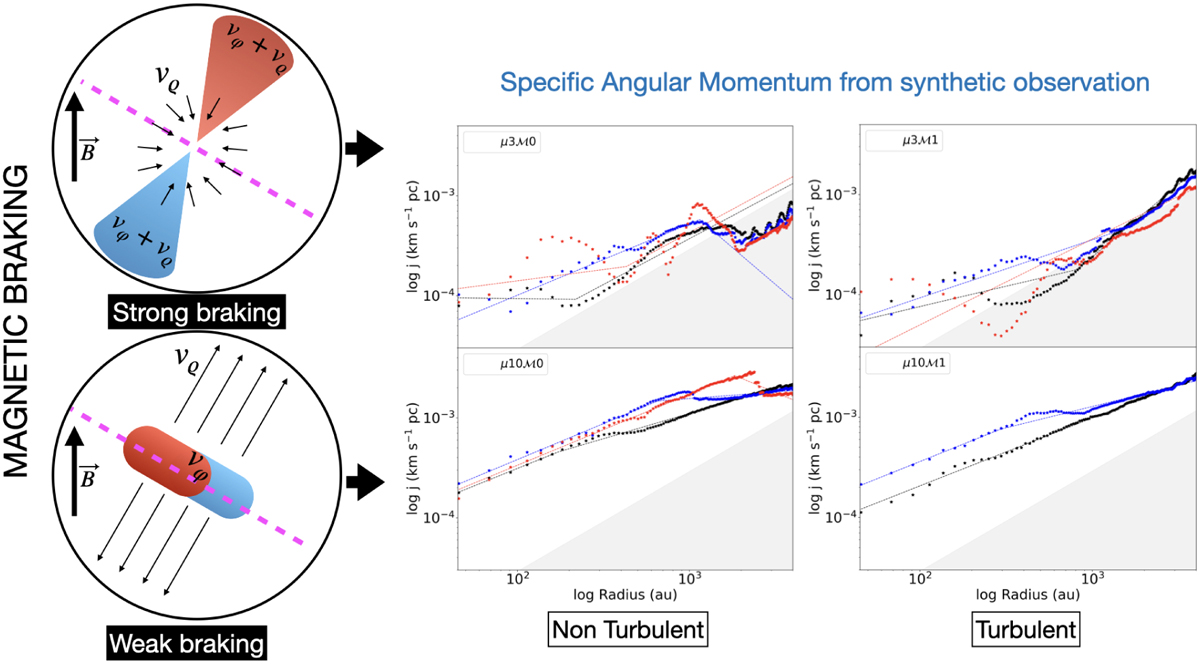
Sketch illustrating the influence of the magnetic field on the SAM in protostellar envelopes, in the case of strong magnetic braking (top row) and weak magnetic braking (bottom row). Left: diagram illustrating the distribution of the rotational, νϕ, and radial, υϱ, velocity components in the case of strong or weak magnetic braking in nonideal MHD models. Thin black arrows depict the radial velocity component. The thick black arrow shows the initial orientation of the magnetic field. Red and blue shapes show the rotational component of the velocity field. The dashed magenta line shows the equatorial plane, perpendicular to the rotational axis, along which the SAM profiles were computed. Right: radial profiles of the observed SAM. The blue, red, and black stars show the SAM radial profiles computed from synthetic observations of the C18O (2−1) moment 1 maps, and dashed lines show the best-fit broken power law models for the three evolutionary stages of the nonturbulent (left) and turbulent (right) models. Values of the χ2 per degree of freedom are reported in Table 2.
Current usage metrics show cumulative count of Article Views (full-text article views including HTML views, PDF and ePub downloads, according to the available data) and Abstracts Views on Vision4Press platform.
Data correspond to usage on the plateform after 2015. The current usage metrics is available 48-96 hours after online publication and is updated daily on week days.
Initial download of the metrics may take a while.