Fig. 4
Download original image
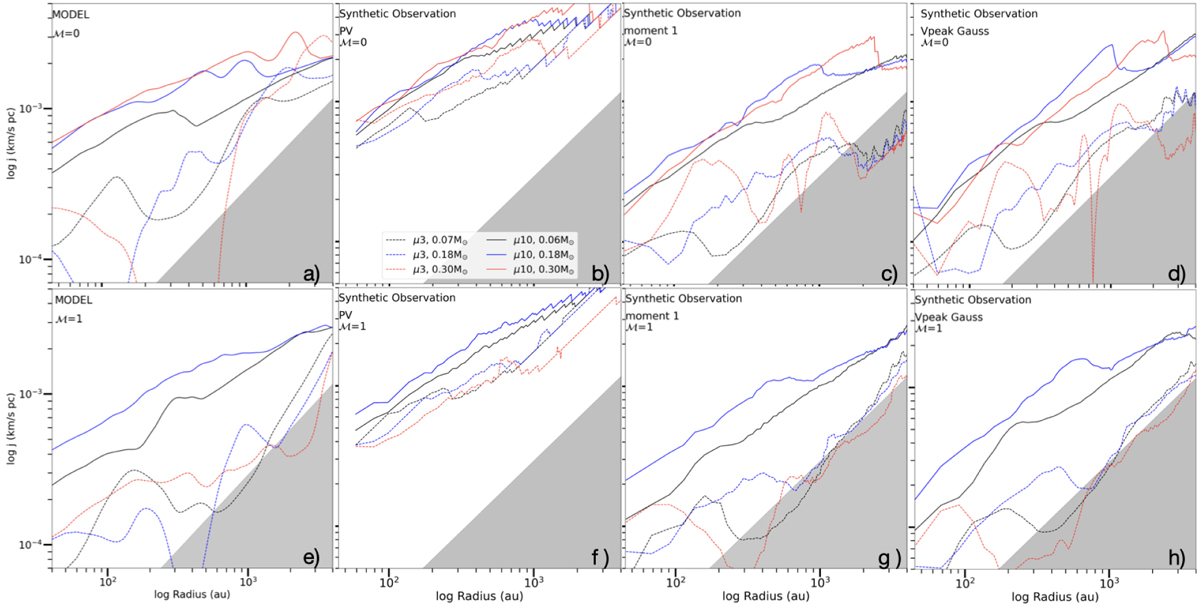
SAM radial profiles computed through the equatorial plane for nonturbulent (upper row) and turbulent (lower row) models. The first column shows the profiles from the models, while the second to last columns show the profiles from synthetic observations of the models, using different techniques to measure the rotational velocities (see Sect. 3). More (μ = 3.33) and less (μ = 10) magnetized models are depicted with dotted and solid lines, respectively. Different evolutionary states are represented on a color scale: black, blue, and red for protostellar masses equal to ~0.06/0.07, 0.18, and 0.30 M⊙, respectively. The shaded gray area represents the region that cannot be sampled because it lies below the velocity resolution of synthetic observations (0.06 km s−1).
Current usage metrics show cumulative count of Article Views (full-text article views including HTML views, PDF and ePub downloads, according to the available data) and Abstracts Views on Vision4Press platform.
Data correspond to usage on the plateform after 2015. The current usage metrics is available 48-96 hours after online publication and is updated daily on week days.
Initial download of the metrics may take a while.