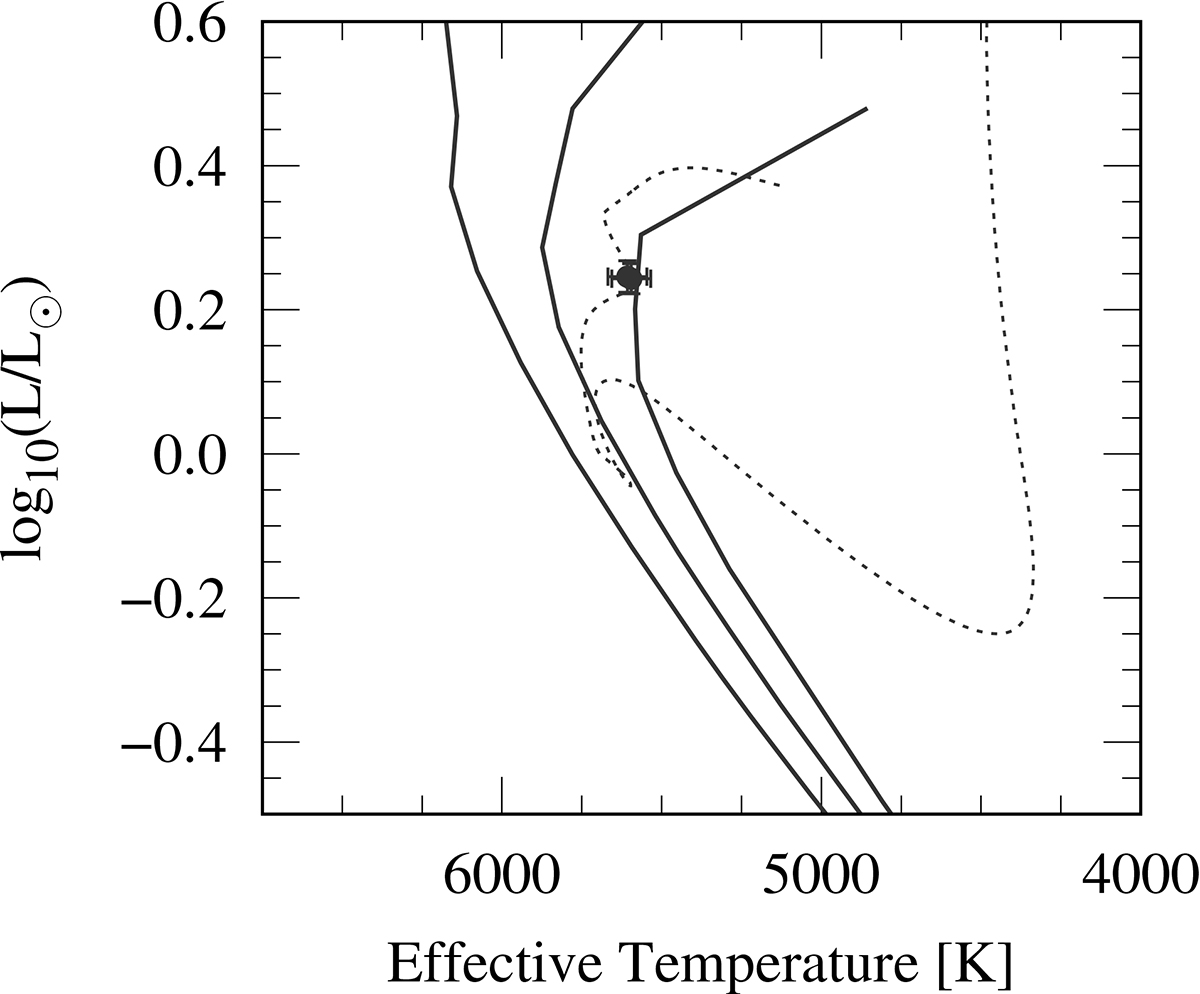
Fig. 15.

Download original image
Hertzsprung-Russell diagram showing the two components of NY Hya (solid points) against three standard Dartmouth stellar evolution model isochrones (solid lines) and a single stellar evolution model mass track (dotted line). Isochrones are shown with the same line style to provide contrast with the individual mass track. From left to right (warmer to cooler), the isochrones are ([Fe/H], τage) = (+0.0, 4.4 Gyr), (+0.2, 5.7 Gyr), and (+0.4, 7.3 Gyr). The stellar evolution mass track is showing an M = 1.160 M⊙ model with [Fe/H] = +0.4.
Current usage metrics show cumulative count of Article Views (full-text article views including HTML views, PDF and ePub downloads, according to the available data) and Abstracts Views on Vision4Press platform.
Data correspond to usage on the plateform after 2015. The current usage metrics is available 48-96 hours after online publication and is updated daily on week days.
Initial download of the metrics may take a while.


