Open Access
Fig. 13.
Download original image
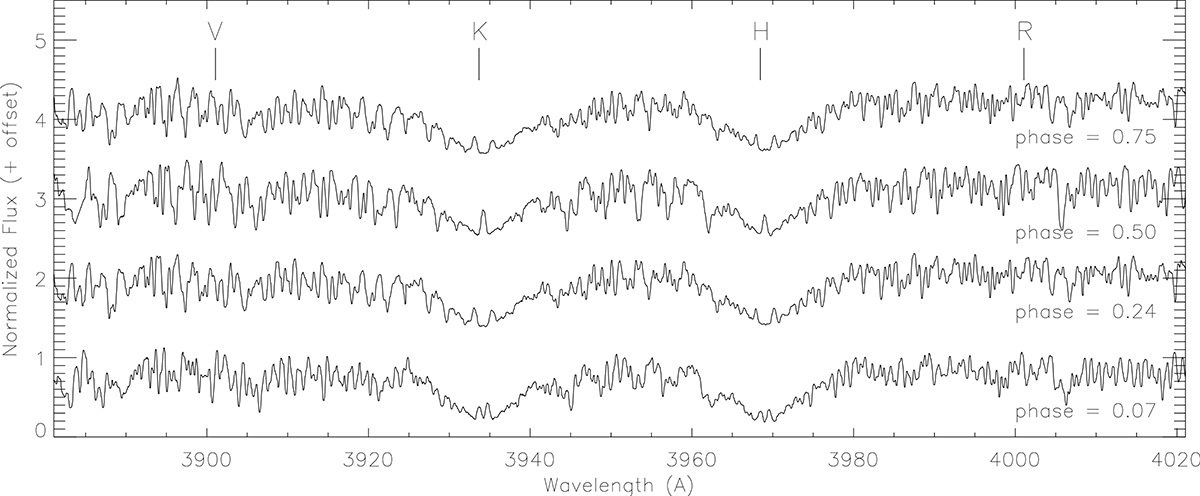
Wavelength region around the Ca II K and H lines (3933.66 Å and 3968.47 Å) at different orbital phases. Core emission lines are visible for both components demonstrating chromospheric activity. The outermost vertical lines mark the location of the V and R continuum bands at 3901.07 Å and 4001.70 Å.
Current usage metrics show cumulative count of Article Views (full-text article views including HTML views, PDF and ePub downloads, according to the available data) and Abstracts Views on Vision4Press platform.
Data correspond to usage on the plateform after 2015. The current usage metrics is available 48-96 hours after online publication and is updated daily on week days.
Initial download of the metrics may take a while.