Fig. 11.
Download original image
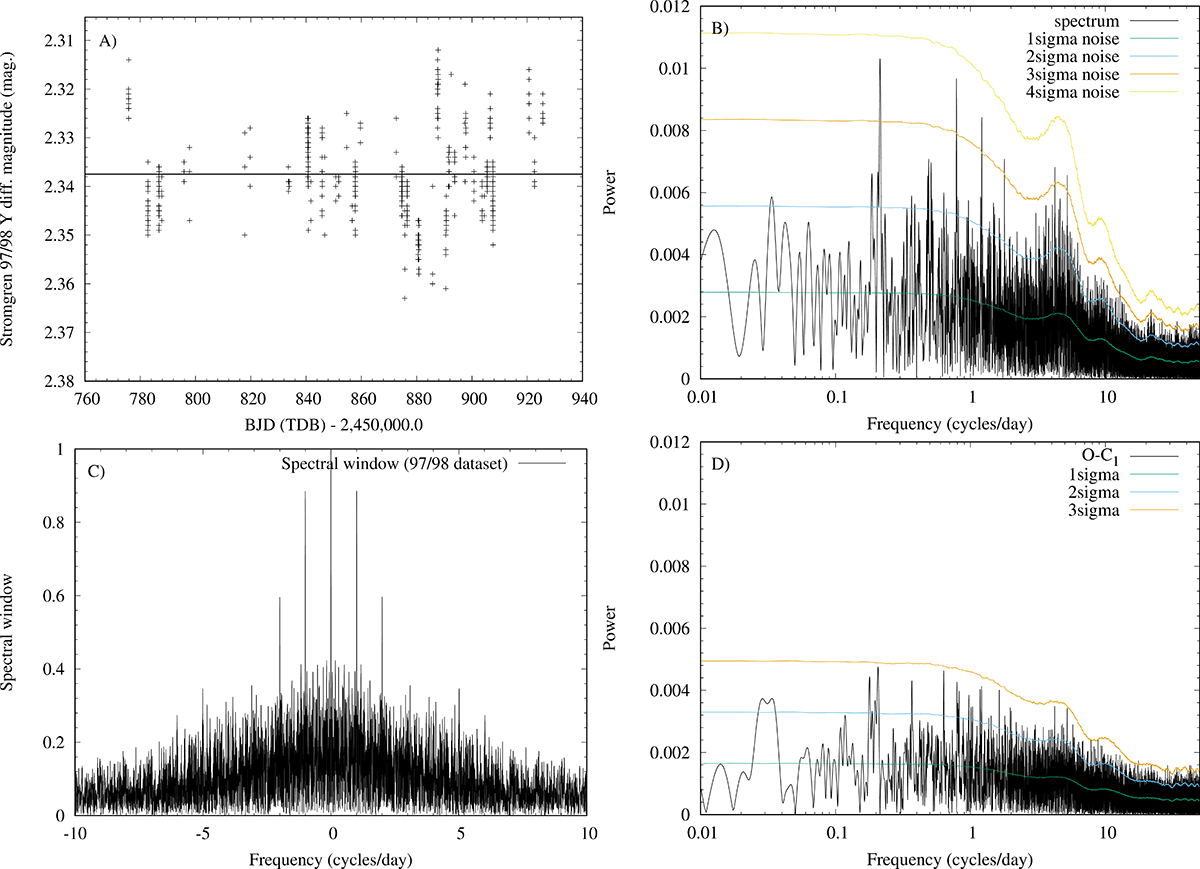
Results of the period analysis for the SAT 97/98 y-band data set. Panel A: 404 y out-of-eclipse photometry showing magnitude vs. time where the primary and secondary eclipses have been removed. The horizontal line is the mean flux out of the eclipses as determined by PERIOD04 and was subtracted prior to the computation of the Fourier spectrum. Panel B: power spectrum and 1, 2, and 3σ noise levels. A frequency at f1 = 0.2138 c/d is detected corresponding to a period of 4.68 days. Frequencies near 1 c/d are likely daily/nightly alias frequencies. Panel C: power spectrum of the spectral (data gap structure) window. Panel D: power spectrum after removing the f1 frequency component with the highest power. Panels B and D have the same scale along the y-axis.
Current usage metrics show cumulative count of Article Views (full-text article views including HTML views, PDF and ePub downloads, according to the available data) and Abstracts Views on Vision4Press platform.
Data correspond to usage on the plateform after 2015. The current usage metrics is available 48-96 hours after online publication and is updated daily on week days.
Initial download of the metrics may take a while.