Fig. 10.
Download original image
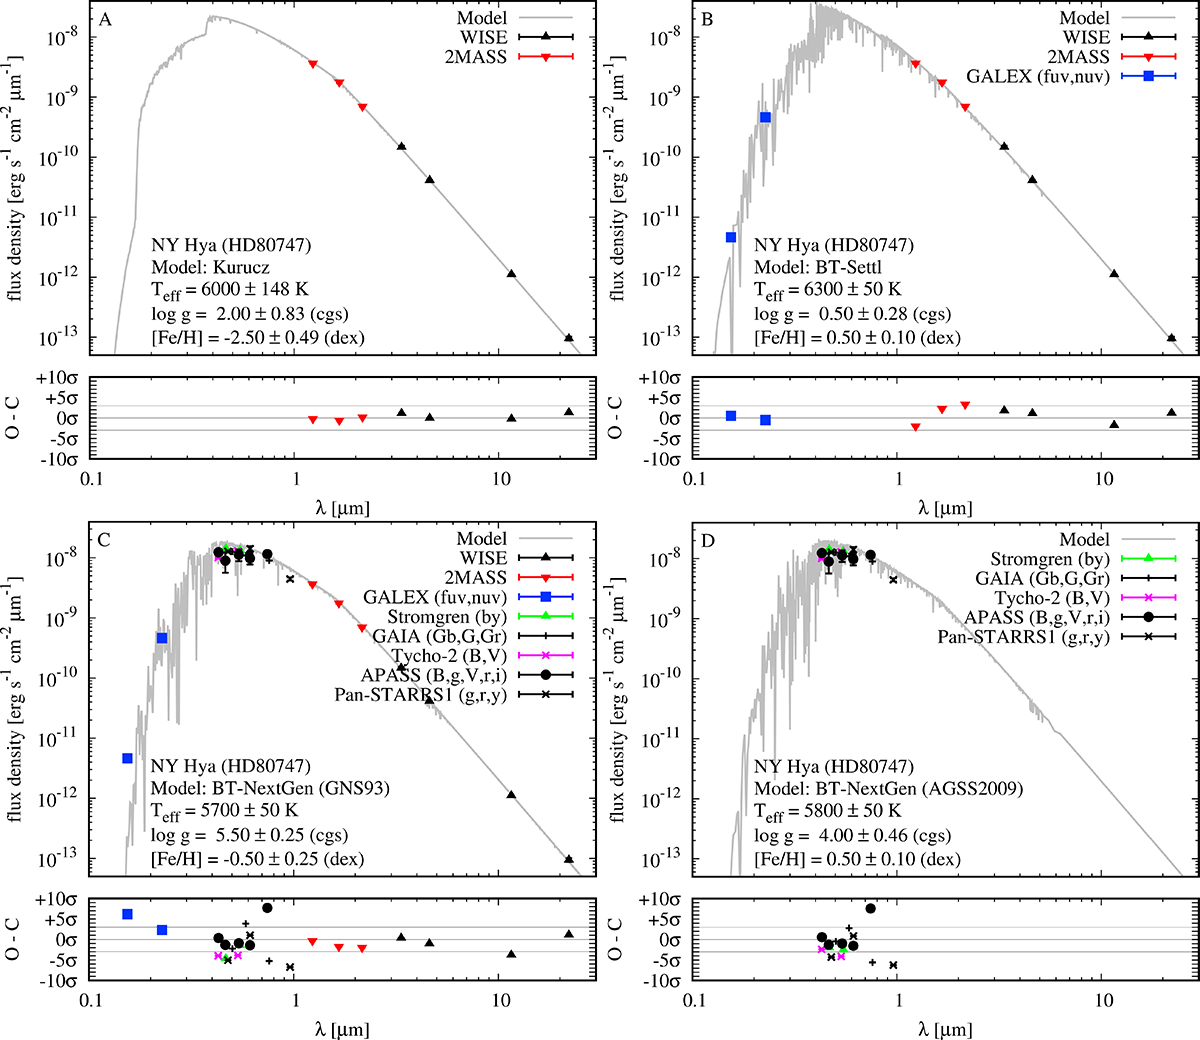
VOSA SED model fits (corrected for extinction) for various data sets of flux measurements for NY Hya. The horizontal lines in the residual plots mark ±3σ deviation from the model. Panel A: WISE and 2MASS flux measurements ![]() . Panel B: WISE, 2MASS, and GALEX fluxes
. Panel B: WISE, 2MASS, and GALEX fluxes ![]() . Panel C: almost all available archive data with < 10σ deviations (
. Panel C: almost all available archive data with < 10σ deviations (![]() ; see Table 9 for details). Panel D: only retaining flux measurements around 7000 Å
; see Table 9 for details). Panel D: only retaining flux measurements around 7000 Å ![]() . The APASS Sloan i measurement deviates at a 8 − 9σ level (see text for details). Some error bars are smaller than the symbol size. In all cases, no infrared excess was detected eventually pointing towards a circumstellar disc and/or a cool companion. We also note that data for each model has been thinned to reduce data size.
. The APASS Sloan i measurement deviates at a 8 − 9σ level (see text for details). Some error bars are smaller than the symbol size. In all cases, no infrared excess was detected eventually pointing towards a circumstellar disc and/or a cool companion. We also note that data for each model has been thinned to reduce data size.
Current usage metrics show cumulative count of Article Views (full-text article views including HTML views, PDF and ePub downloads, according to the available data) and Abstracts Views on Vision4Press platform.
Data correspond to usage on the plateform after 2015. The current usage metrics is available 48-96 hours after online publication and is updated daily on week days.
Initial download of the metrics may take a while.