Fig. 2.
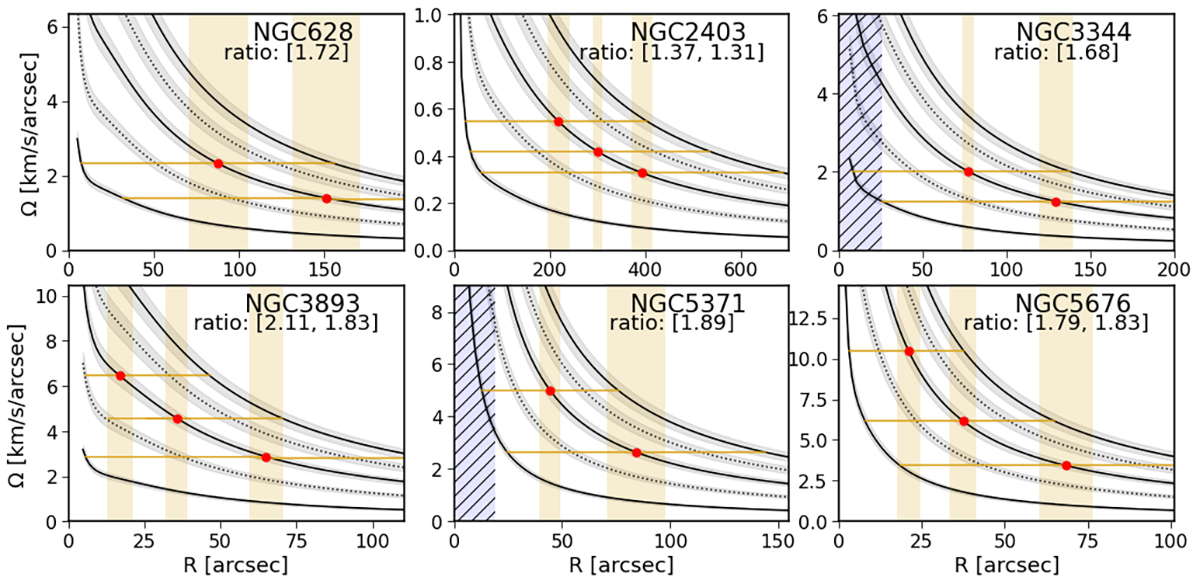
Download original image
Angular velocity and resonances curves: solid lines show Ω, ILR, and OLR; dotted lines show IUHR and OUHR. Areas filled with gray colour represent error associated with RC. Red points show the average position of each CR. Horizontal lines demonstrate extension of each spiral pattern from it’s inner resonance (ILR or IUHR) to the outer one (OLR). Numbers show ϖ for consecutive patterns. Blue hatched areas mark bar size from Herrera-Endoqui et al. (2015).
Current usage metrics show cumulative count of Article Views (full-text article views including HTML views, PDF and ePub downloads, according to the available data) and Abstracts Views on Vision4Press platform.
Data correspond to usage on the plateform after 2015. The current usage metrics is available 48-96 hours after online publication and is updated daily on week days.
Initial download of the metrics may take a while.