Open Access
Fig. 1.
Download original image
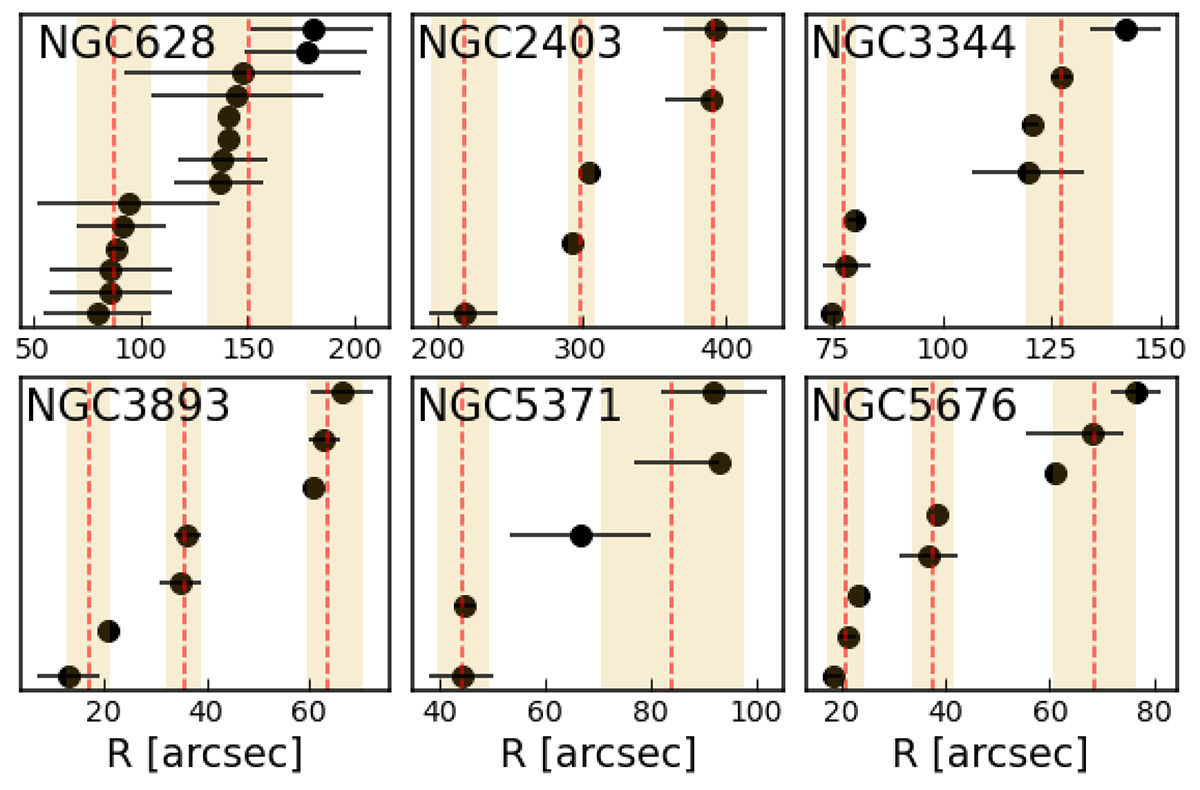
Positions of CR from Table A.2 (points). Colored vertical areas show boundaries of assumed CR for each pattern, dashed red line shows average value for points within each CR. Vertical axis is shown for illustrative purposes only.
Current usage metrics show cumulative count of Article Views (full-text article views including HTML views, PDF and ePub downloads, according to the available data) and Abstracts Views on Vision4Press platform.
Data correspond to usage on the plateform after 2015. The current usage metrics is available 48-96 hours after online publication and is updated daily on week days.
Initial download of the metrics may take a while.