Open Access
Fig. B.1.
Download original image
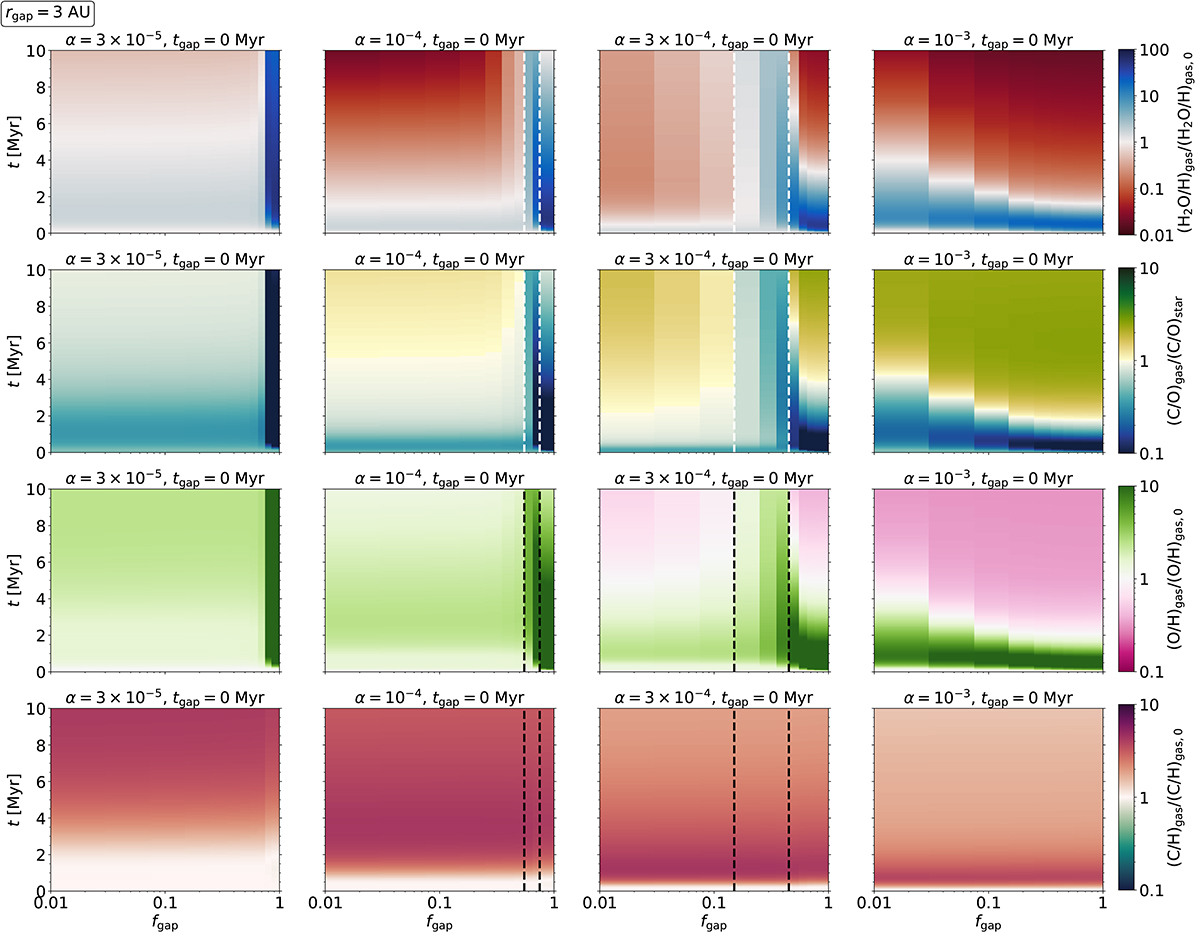
Time evolution of the water abundance and abundance ratios of selected elements at 0.5 AU as a function of α. Results are normalised to the initial values at this location. Here the gap is located at 3 AU (beyond the water ice line but interior to the CO2 ice line) and forms immediately at tgap = 0 Myr.
Current usage metrics show cumulative count of Article Views (full-text article views including HTML views, PDF and ePub downloads, according to the available data) and Abstracts Views on Vision4Press platform.
Data correspond to usage on the plateform after 2015. The current usage metrics is available 48-96 hours after online publication and is updated daily on week days.
Initial download of the metrics may take a while.