Fig. 1.
Download original image
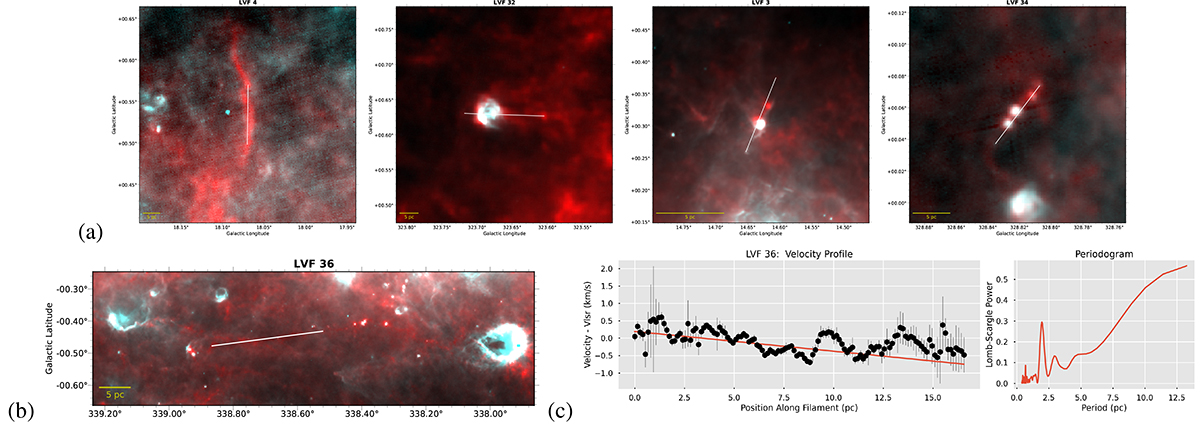
Representative filaments and PV analysis. (a) Representative filaments in a two-color view. Herschel 250 μm and 70 μm emission are shown in red and cyan, respectively. A filament is marked by an end-to-end line connecting two clumps at the filament tips. From left to right are four representative categorizes: Quiescent, Flower, Central, and Necklace. Figure A.3 shows all the filaments. (b) Same two-color view, but for F36, part of Nessie. (c)13CO (2–1) PV plot of F36 along curved filament length, and fitting to the global velocity gradient (red line), where the error bars correspond to 1σ dispersion. The periodogram of the PV curve after removing the global velocity gradient shows a period at 2 pc, consistent with clump separation (Sect. 3.3).
Current usage metrics show cumulative count of Article Views (full-text article views including HTML views, PDF and ePub downloads, according to the available data) and Abstracts Views on Vision4Press platform.
Data correspond to usage on the plateform after 2015. The current usage metrics is available 48-96 hours after online publication and is updated daily on week days.
Initial download of the metrics may take a while.