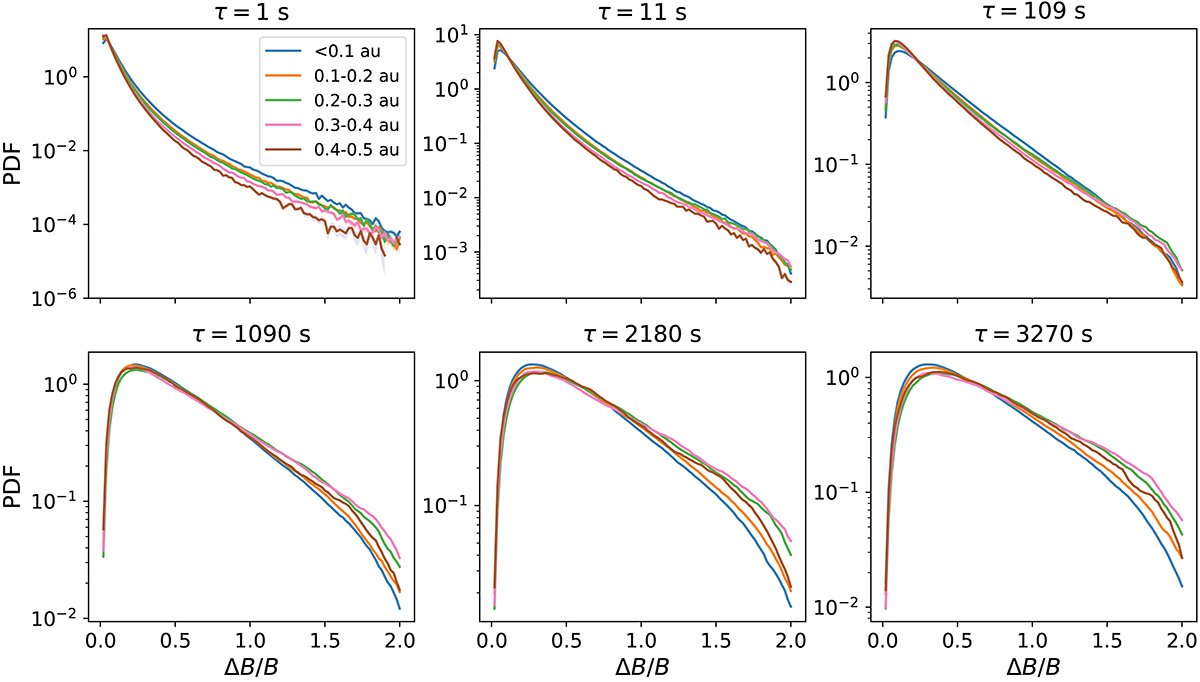
Fig. 1.
Download original image
Distributions of the magnetic field increments ΔB/B. The increments are computed at different timescales, τ, for each panel, as indicated at the top. The different colours represent different heliocentric distances. The shaded area represents the statistical error estimated as the square root of the number of points in a given bin. The error is not visible in most cases because it is small and comparable with the width of the plot lines.
Current usage metrics show cumulative count of Article Views (full-text article views including HTML views, PDF and ePub downloads, according to the available data) and Abstracts Views on Vision4Press platform.
Data correspond to usage on the plateform after 2015. The current usage metrics is available 48-96 hours after online publication and is updated daily on week days.
Initial download of the metrics may take a while.