Fig. D.2.
Download original image
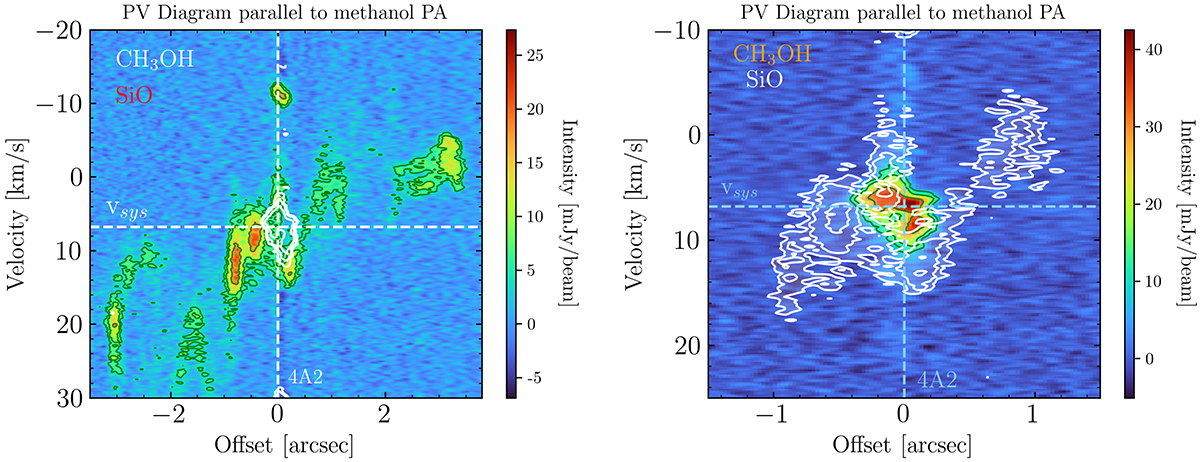
SiO and CH3OH PV diagrams extracted from different paths. Left: PV Diagram extracted over the path of ∼7″ in length that follows the SiO structures (white in Figure D.1). The SiO emission is shown in colour scale. Green and white contours at (3,5,10) σ are for CH3OH (σ ∼ 2 mJy beam−1) and SiO (σm∼1.6 mJy beam−1), respectively. Right PV diagram extracted over the region of 3″ in length passing through methanol and SiO PA in the inner ![]() (shown in red in the left panel). The methanol emission is shown in colour scale with green contours (at 3,5,10 σm with σm∼3 mJy beam−1). The SiO emission is shown in white contours at (3,5,10, 20) σs with σs∼1.5 mJy beam−1. In both panels, the vertical and horizontal dashed lines represent the vsys (∼6.8 km s−1; Choi 2001), and the 0″ offset (on the 4A2 protostar), respectively.
(shown in red in the left panel). The methanol emission is shown in colour scale with green contours (at 3,5,10 σm with σm∼3 mJy beam−1). The SiO emission is shown in white contours at (3,5,10, 20) σs with σs∼1.5 mJy beam−1. In both panels, the vertical and horizontal dashed lines represent the vsys (∼6.8 km s−1; Choi 2001), and the 0″ offset (on the 4A2 protostar), respectively.
Current usage metrics show cumulative count of Article Views (full-text article views including HTML views, PDF and ePub downloads, according to the available data) and Abstracts Views on Vision4Press platform.
Data correspond to usage on the plateform after 2015. The current usage metrics is available 48-96 hours after online publication and is updated daily on week days.
Initial download of the metrics may take a while.