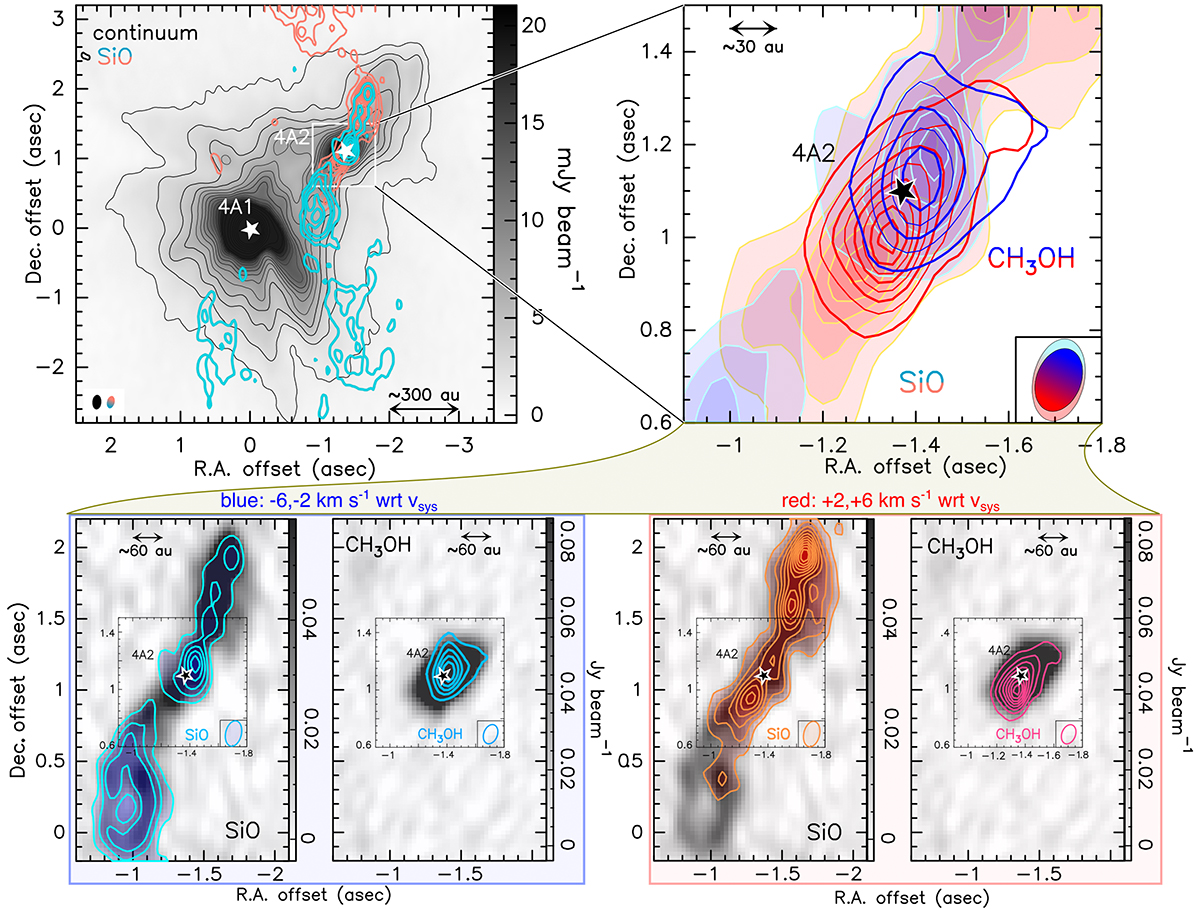
Fig. 1.
Download original image
Overview of the SiO and CH3OH emission toward IRAS 4A2 at different scales. Upper left: superposition of the 1.3 mm continuum (grey scale, up to 20% of maximum flux, with contours starting at 15σc with steps of 20σc, where σc = 8 × 10⁻² mJy beam−1) with SiO redshifted and blueshifted emission (salmon and cyan contours, respectively, from 3σ with steps of 4σ, where σ = 2 mJy beam−1 km s−1). Upper right: zoom onto IRAS 4A2. Superposition of the redshifted and blueshifted emission of SiO (salmon and cyan shaded contours) and CH3OH (red and blue contours). Contours start at 3σ with steps of 4σ for SiO and 5σ for CH3OH (σ = 2 mJy beam−1 km s−1). Beams are shown in the lower corners. Lower panels: blueshifted and redshifted emission for SiO and CH3OH shown separately. The beams are shown in the inner corner. In all panels, white and black stars mark the protostars IRAS 4A1 and IRAS 4A2. The redshifted and blueshifted emissions are integrated between +2 and +6 km s−1, and between −6 and −2 km s−1 with respect to the systemic velocity (vsys = +6.8 km s−1; Choi 2001), respectively. The moment 0 between −6 and 6 km s−1 for each species is shown in greyscale.
Current usage metrics show cumulative count of Article Views (full-text article views including HTML views, PDF and ePub downloads, according to the available data) and Abstracts Views on Vision4Press platform.
Data correspond to usage on the plateform after 2015. The current usage metrics is available 48-96 hours after online publication and is updated daily on week days.
Initial download of the metrics may take a while.