Open Access
Fig. 5
Download original image
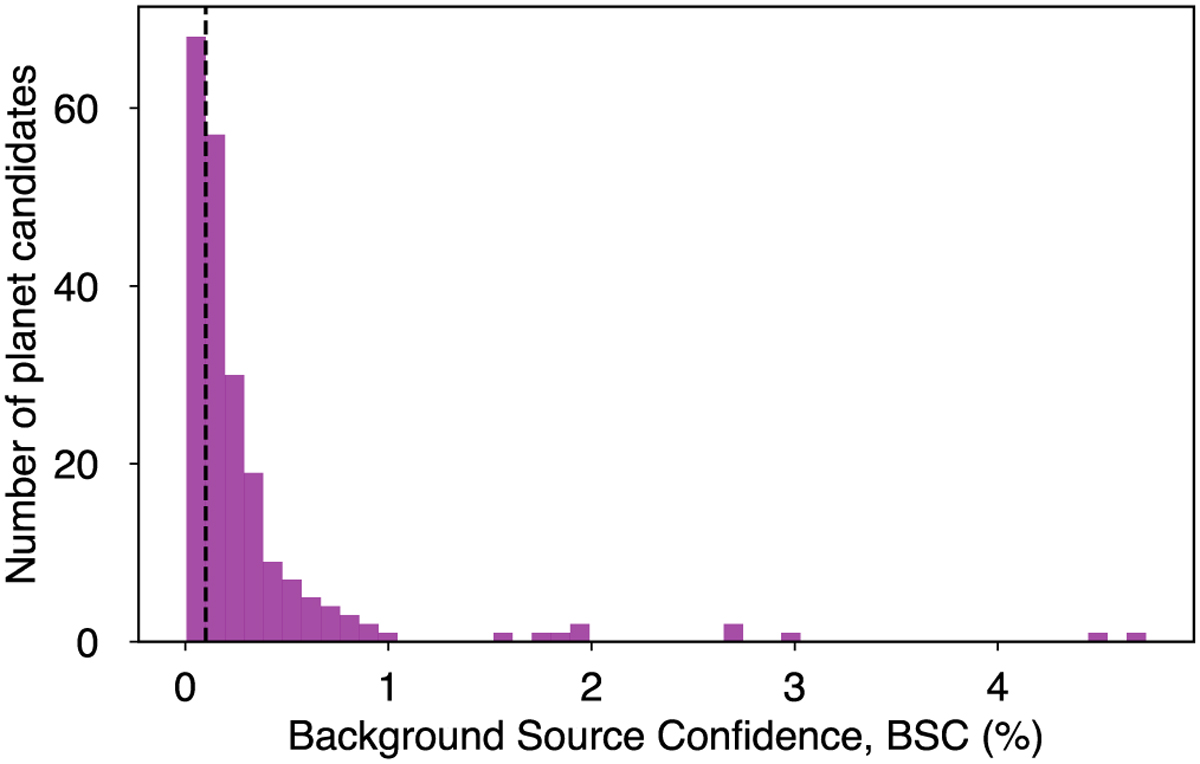
Histogram of the BSC probability calculated after including the sensitivity of our high spatial resolution images for all TOIs observed in this work. The dashed line marks where the BSC is equal to 0.1%.
Current usage metrics show cumulative count of Article Views (full-text article views including HTML views, PDF and ePub downloads, according to the available data) and Abstracts Views on Vision4Press platform.
Data correspond to usage on the plateform after 2015. The current usage metrics is available 48-96 hours after online publication and is updated daily on week days.
Initial download of the metrics may take a while.