Fig. 3.
Download original image
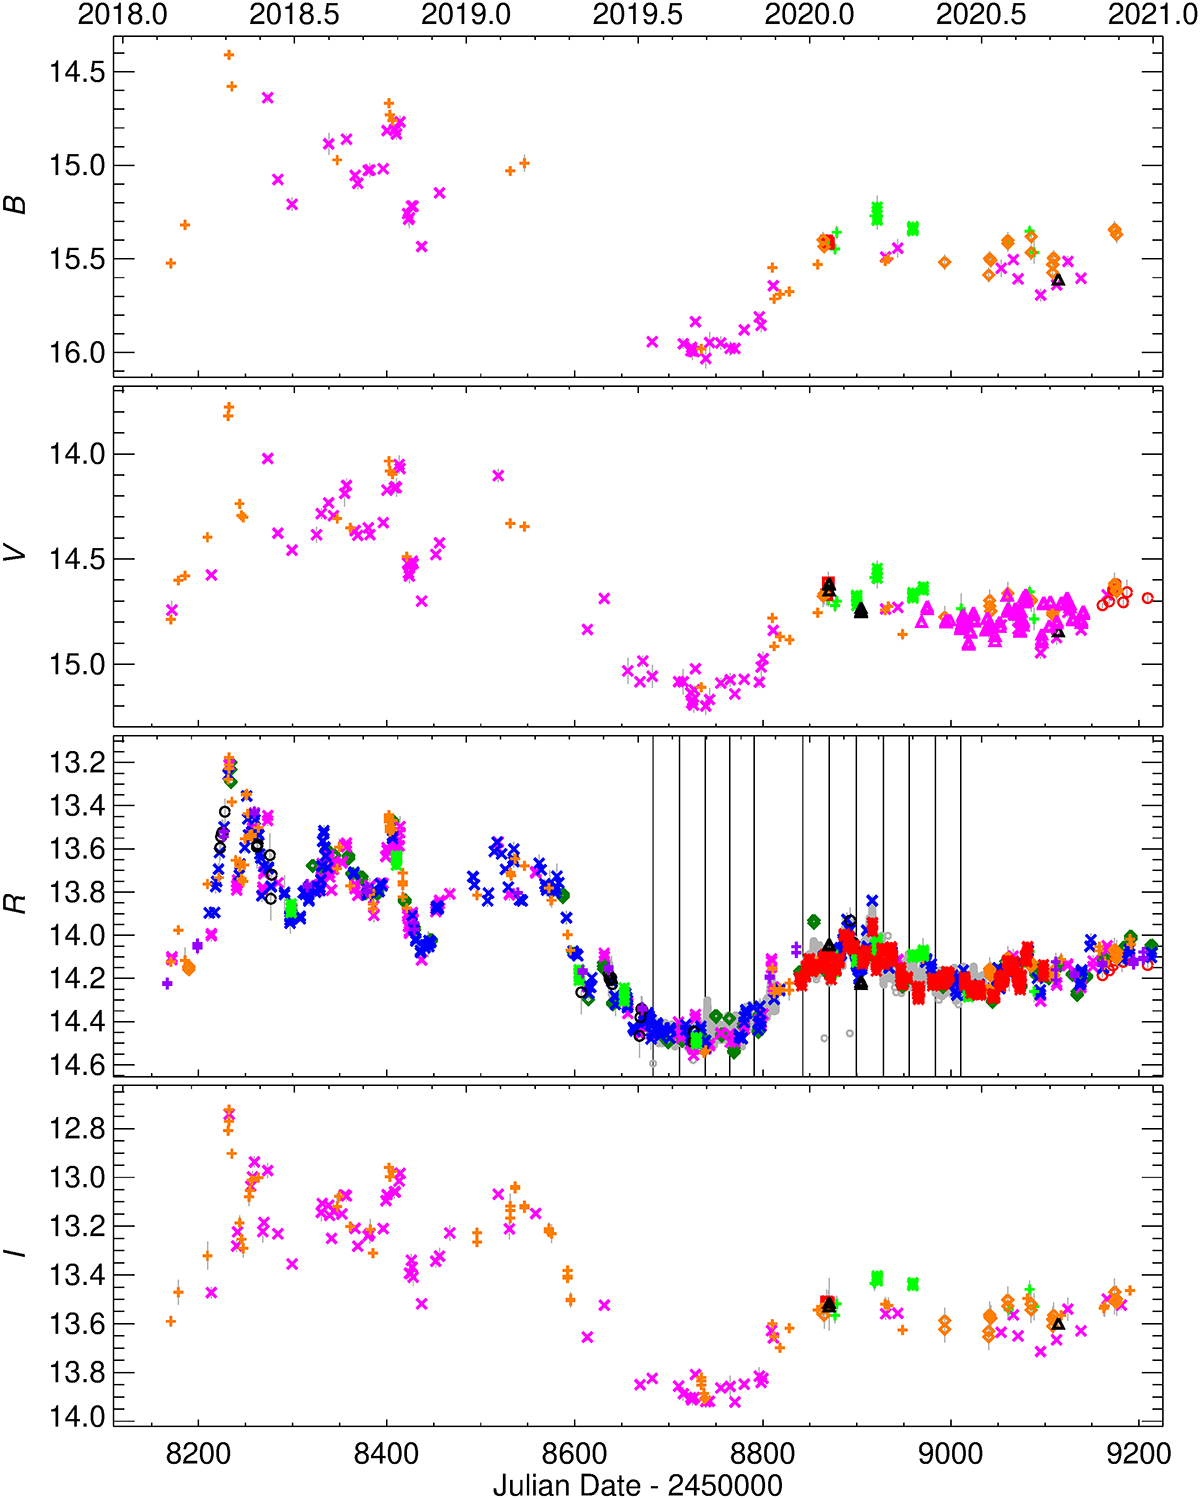
WEBT multiband optical light curves (observed magnitudes) of 3C 371 during the 2018–2020 observing season. Different colors and symbols are used to distinguish the contributing datasets, as specified in Table 2. Vertical lines represent the start of the different TESS sectors during which the source was observed. The R-band calibrated TESS data are represented with gray markers in the third panel.
Current usage metrics show cumulative count of Article Views (full-text article views including HTML views, PDF and ePub downloads, according to the available data) and Abstracts Views on Vision4Press platform.
Data correspond to usage on the plateform after 2015. The current usage metrics is available 48-96 hours after online publication and is updated daily on week days.
Initial download of the metrics may take a while.