Fig. 15.
Download original image
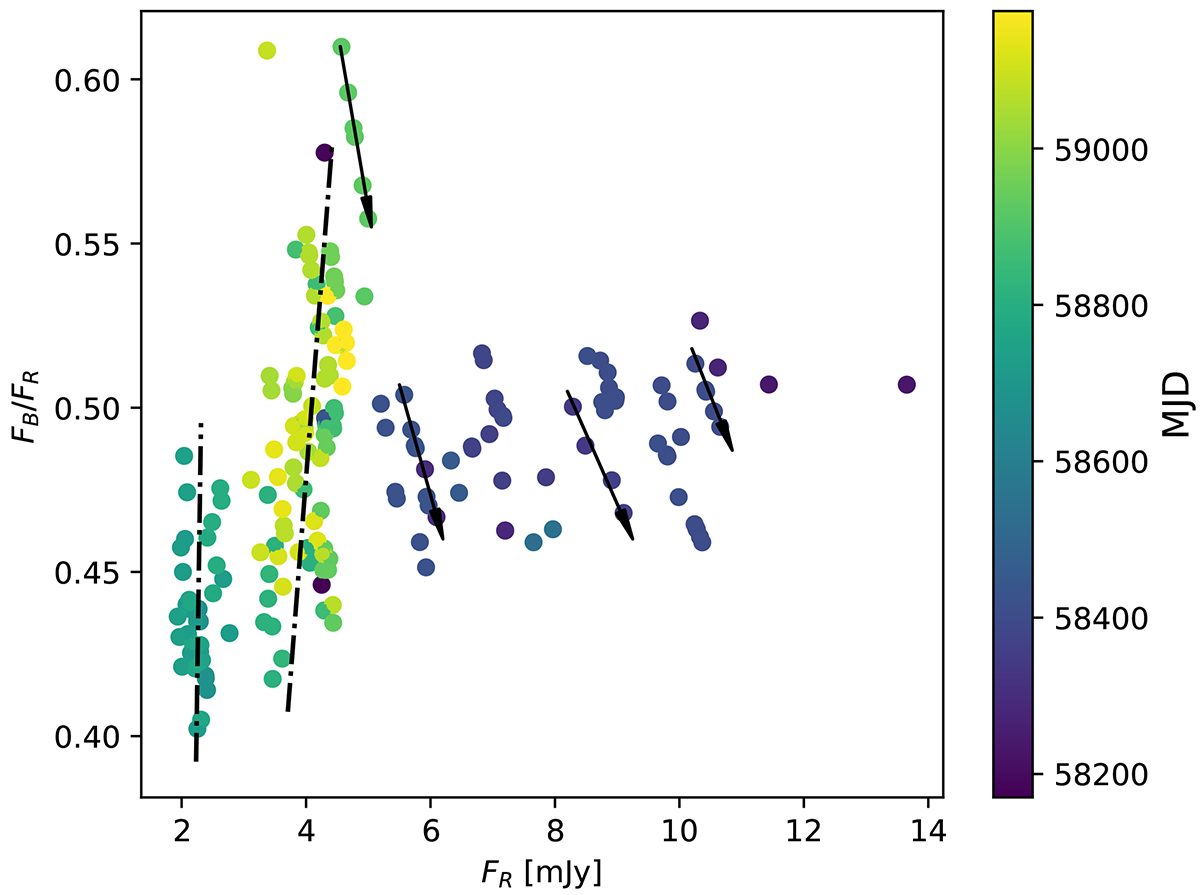
Dereddened, host-galaxy-corrected color index of 3C 371 for the optical B band with respect to the optical R-band flux density. The plot is presented without error bars for clarity. The color scale represents the MJD of the observations. Black dashed-dotted lines indicate the color change of the two low states. Black arrows highlight some examples of short-term RWB variability patterns.
Current usage metrics show cumulative count of Article Views (full-text article views including HTML views, PDF and ePub downloads, according to the available data) and Abstracts Views on Vision4Press platform.
Data correspond to usage on the plateform after 2015. The current usage metrics is available 48-96 hours after online publication and is updated daily on week days.
Initial download of the metrics may take a while.