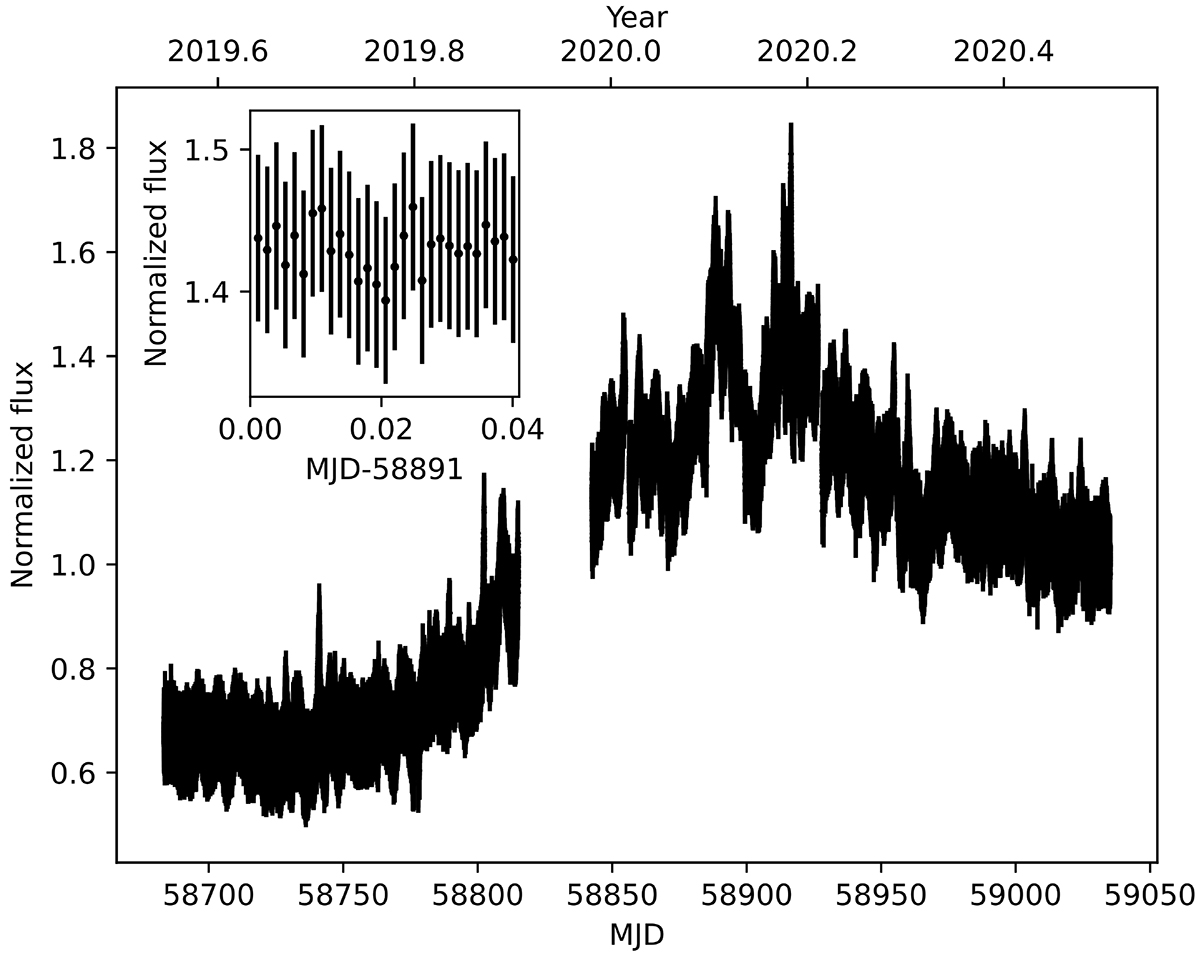
Fig. 1.
Download original image
TESS SAP_FLUX light curve of 3C 371. The offsets between the different sectors were estimated using the observed R-band WEBT light curve, and were then converted into arbitrary flux units and normalized by the mean value. The inset panel corresponds to a zoom onto a 1 h of the light curve to illustrate the cadence and uncertainties of the observations.
Current usage metrics show cumulative count of Article Views (full-text article views including HTML views, PDF and ePub downloads, according to the available data) and Abstracts Views on Vision4Press platform.
Data correspond to usage on the plateform after 2015. The current usage metrics is available 48-96 hours after online publication and is updated daily on week days.
Initial download of the metrics may take a while.