Fig. 4.
Download original image
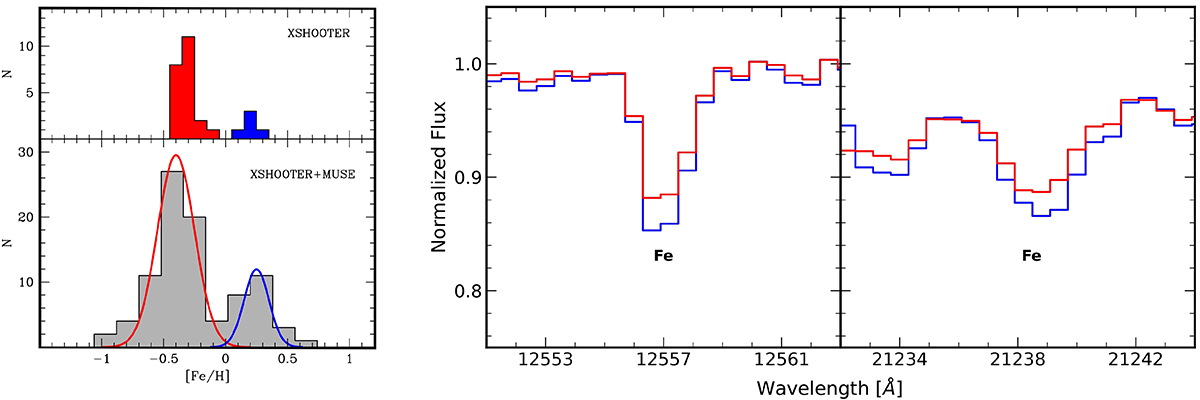
Histograms of the metallicity distribution of Liller 1 (left panel) for the 27 stars observed with X-shooter (top) and for the cumulative sample (from this work and the one by Crociati et al. 2023, bottom). For the sake of illustration, two Gaussian functions reproducing the subsolar and supersolar components are shown as red and blue curves, respectively. For sake of illustration, X-shooter spectra around two iron lines in the J and K bands for a metal-poor (number 39, red line) and a metal-rich (number 35, blue line) star of Liller 1, with similar stellar parameters, are also plotted (right panel).
Current usage metrics show cumulative count of Article Views (full-text article views including HTML views, PDF and ePub downloads, according to the available data) and Abstracts Views on Vision4Press platform.
Data correspond to usage on the plateform after 2015. The current usage metrics is available 48-96 hours after online publication and is updated daily on week days.
Initial download of the metrics may take a while.