Fig. 4.
Download original image
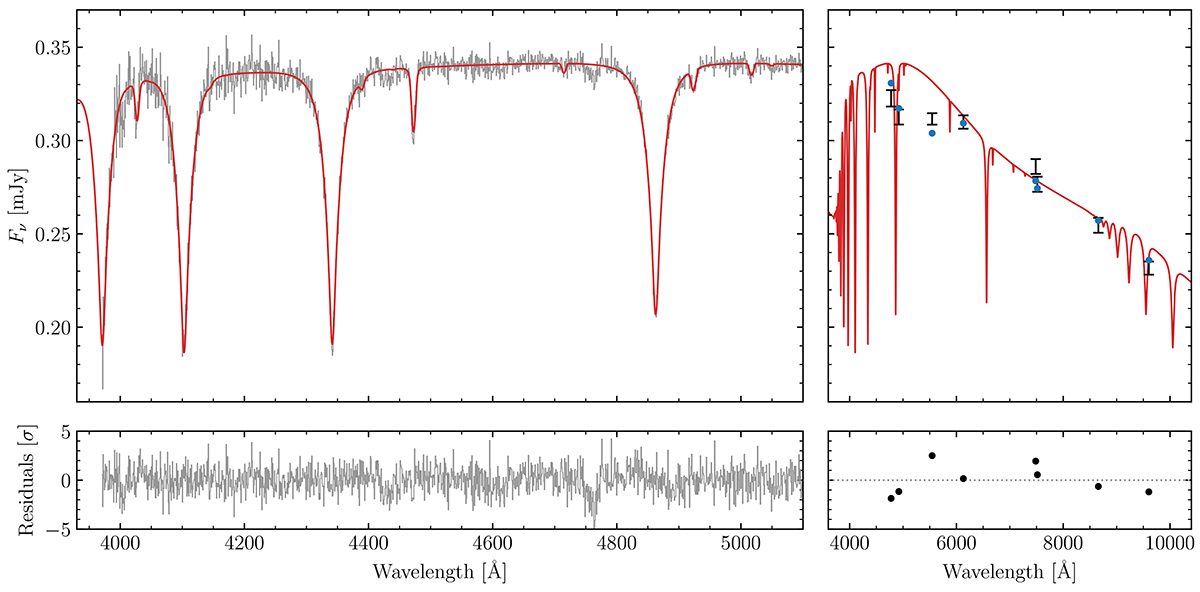
Fit to the spectrum of J0526+5934 (left panels) with the residuals shown below. The best fitting model (red) includes the measured interstellar reddening. The spectral fluxes have been re-calibrated against the model with a spline fit to their ratio. While the GTC spectrum extends to 5700 Å, it is featureless beyond 5100 Å, and so those wavelengths are not shown. The same model is shown against the photometry (black error bars), with synthetic photometry shown by the blue points (right panels). Error bars include the assumed 0.01 mag systematic uncertainty. Again, their residuals are shown below.
Current usage metrics show cumulative count of Article Views (full-text article views including HTML views, PDF and ePub downloads, according to the available data) and Abstracts Views on Vision4Press platform.
Data correspond to usage on the plateform after 2015. The current usage metrics is available 48-96 hours after online publication and is updated daily on week days.
Initial download of the metrics may take a while.