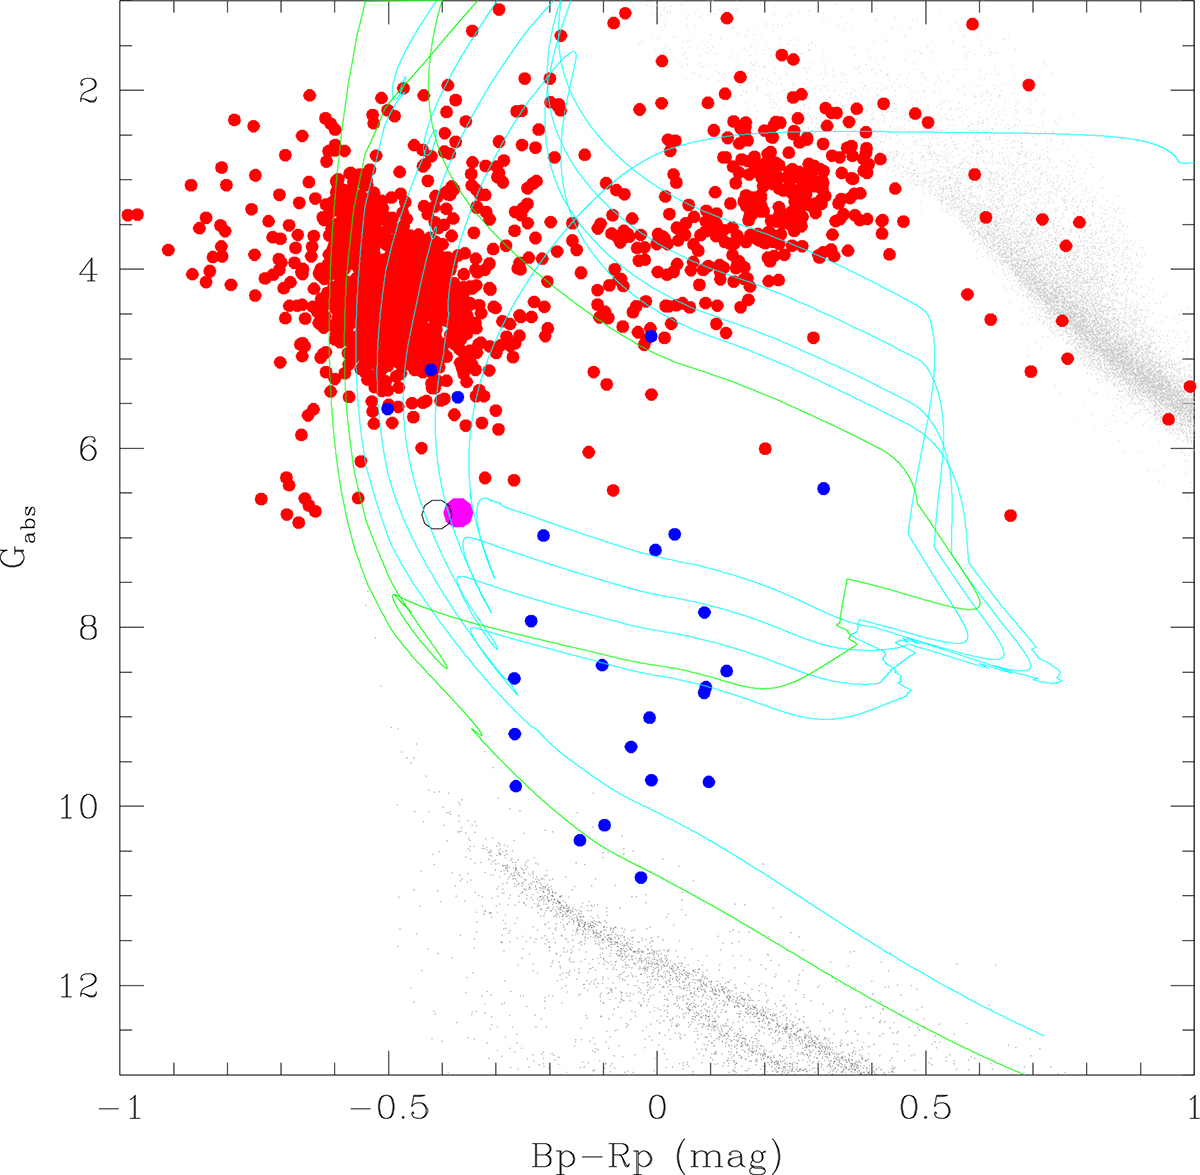
Fig. 2.
Download original image
Absolute magnitude–colour diagram of single white dwarfs (dark grey) and main sequence stars (light grey) within 100 pc from Jiménez-Esteban et al. (2023), hot sub-dwarf stars (red dots) from Geier (2020), and ELM white dwarfs (blue dots) from Brown et al. (2016), Kilic et al. (2017), and Pelisoli et al. (2018). J0526+5934 (solid magenta dot) falls in the transition region between hot sub-dwarf stars and ELM white dwarfs. The open black circle represents the Gabs vs. Bp-Rp that we obtain for J0526+5934 from our spectral modelling (Sect. 4.2), which is in good agreement with the Gaia observed value (magenta dot). All magnitudes have been de-reddened using the extinction provided by the Lallement et al. (2014) 3D maps except for J0526+5934 (in this case, we used the reddening obtained from our analysis; Sect. 4.2), and only objects with positive parallaxes and relative errors below 10% have been considered. The cyan and green lines represent the evolutionary tracks for a 0.226 M⊙ and a 0.324 M⊙ ELM white dwarf, respectively, from Istrate et al. (2016).
Current usage metrics show cumulative count of Article Views (full-text article views including HTML views, PDF and ePub downloads, according to the available data) and Abstracts Views on Vision4Press platform.
Data correspond to usage on the plateform after 2015. The current usage metrics is available 48-96 hours after online publication and is updated daily on week days.
Initial download of the metrics may take a while.