Open Access
Fig. 2.
Download original image
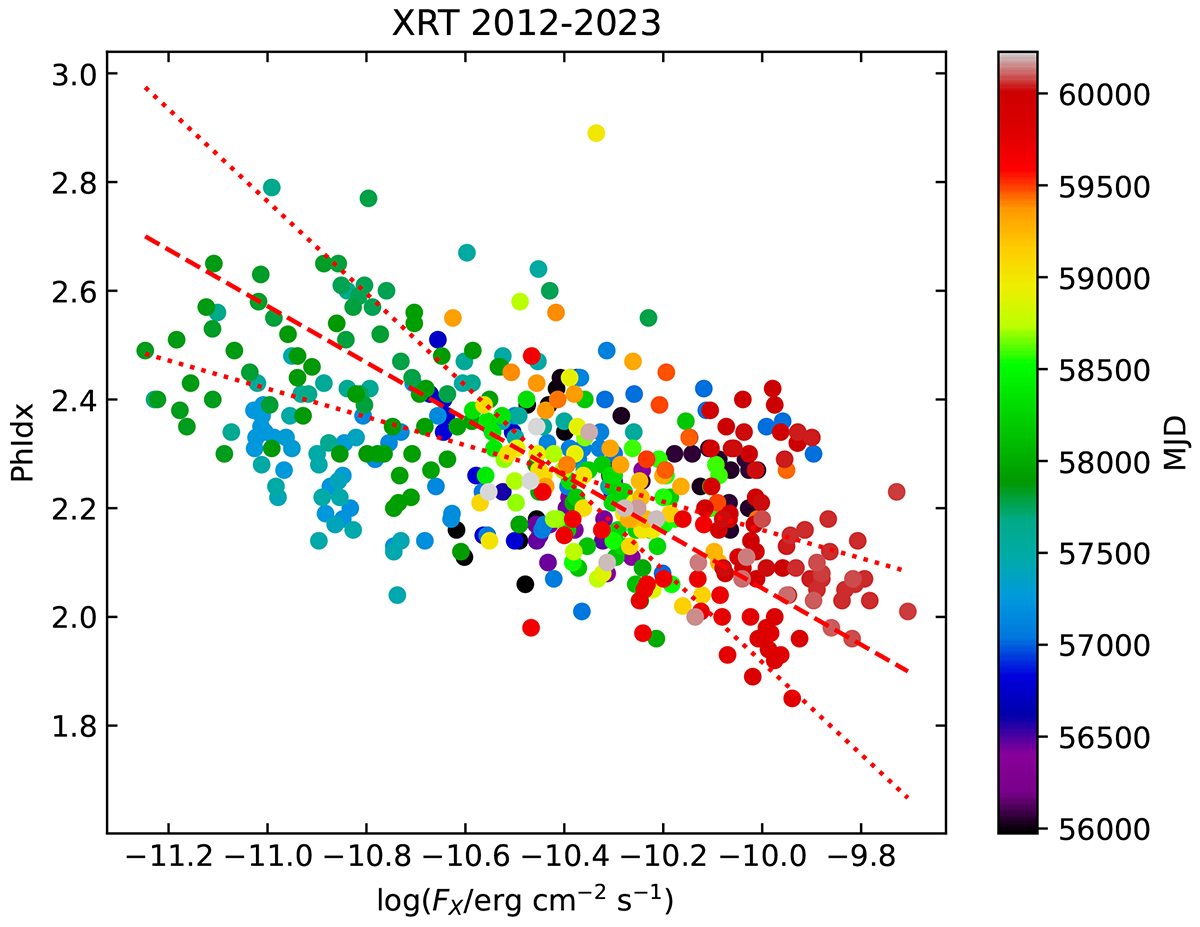
PG 1553+113 X-ray photon index–to-flux correlation. The two linear fits of photon index versus flux and vice versa (red dotted lines) are shown along with the corresponding bisector fit (red dashed line). The data points are color-coded on the basis of their MJD.
Current usage metrics show cumulative count of Article Views (full-text article views including HTML views, PDF and ePub downloads, according to the available data) and Abstracts Views on Vision4Press platform.
Data correspond to usage on the plateform after 2015. The current usage metrics is available 48-96 hours after online publication and is updated daily on week days.
Initial download of the metrics may take a while.