Open Access
Fig. 1.
Download original image
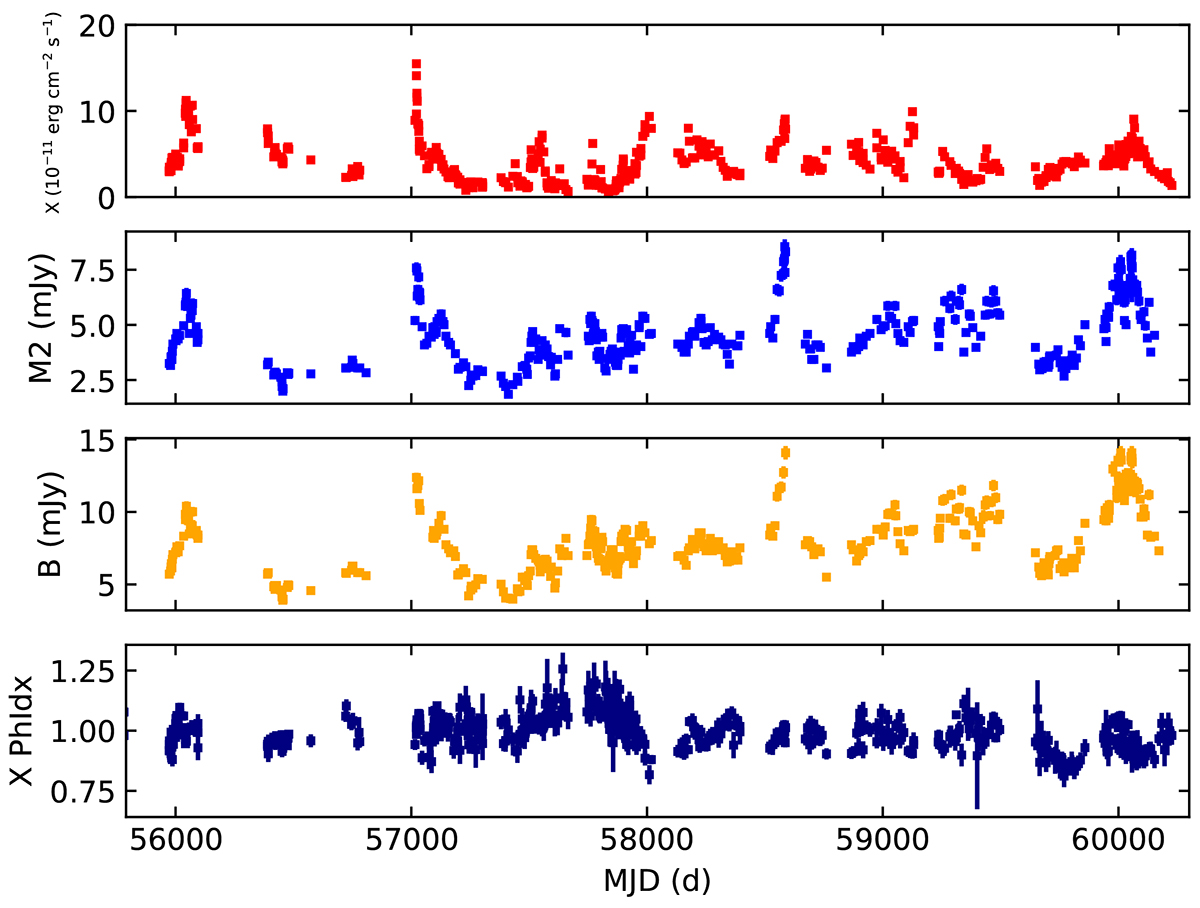
MWL LCs of PG 1153+113 in B (yellow dots), M2 (blue dots), X-ray (red dots) bands, and spectral index (dark blue dots) from 2012 to 2023 of Swift satellite. The X-ray fluxes are in 0.2−10 keV band. B, M2, and X-ray’s LCs are shown along with the corresponding 1σ uncertainties.
Current usage metrics show cumulative count of Article Views (full-text article views including HTML views, PDF and ePub downloads, according to the available data) and Abstracts Views on Vision4Press platform.
Data correspond to usage on the plateform after 2015. The current usage metrics is available 48-96 hours after online publication and is updated daily on week days.
Initial download of the metrics may take a while.