Fig. 9.

Download original image
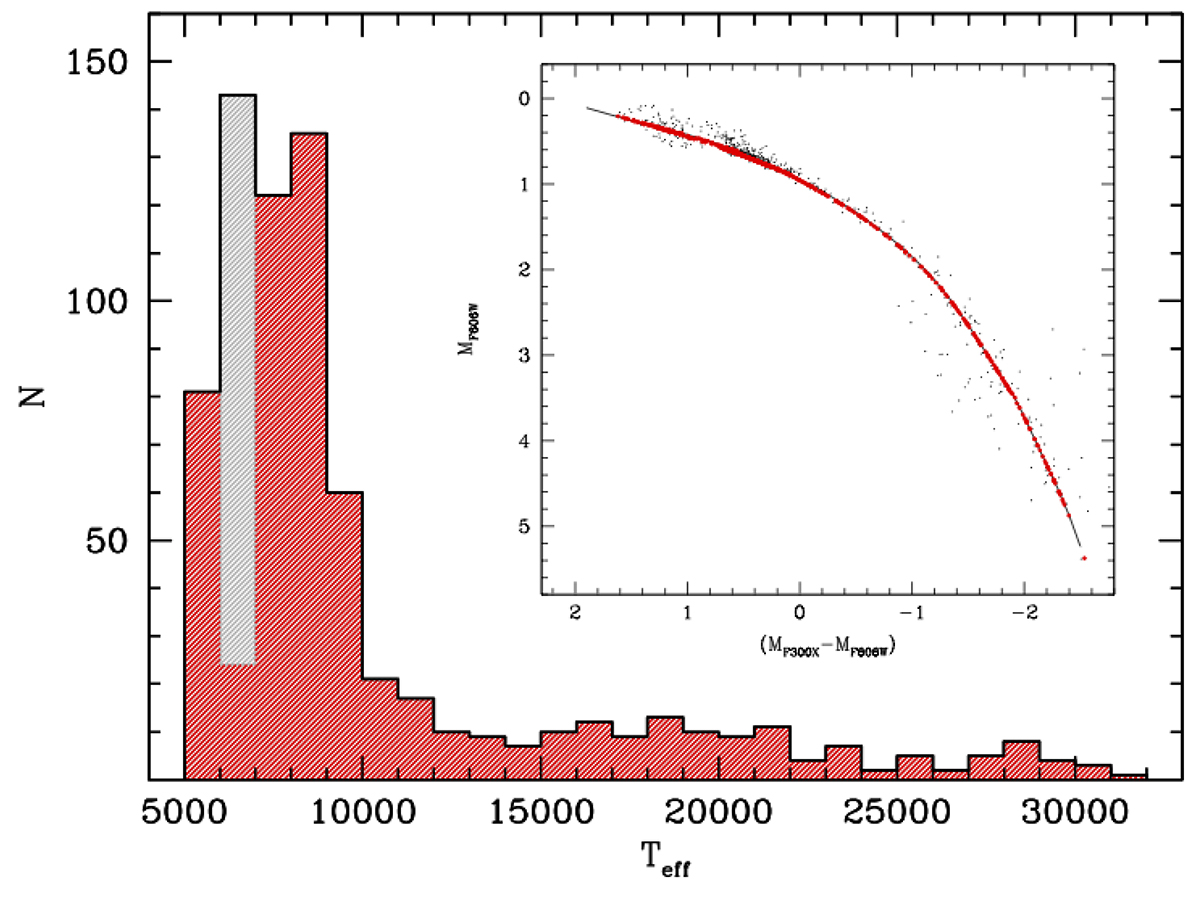
Effective temperature distribution of the HB stars in NGC 1835. The histogram shaded in grey refers to the sample of 119 confirmed and candidate variable stars distributed within the range of temperatures covered by the instability strip (6000 < Teff < 7000). The inset shows the locations of non-variable HB stars in the absolute CMD (black dots) and the corresponding positions projected onto the HB mean ridge line (red dots along the solid black line). The colour axis is inverted (with bluer colours to the right) to be consistent with the x-axis of the histogram (increasing temperature to the right).
Current usage metrics show cumulative count of Article Views (full-text article views including HTML views, PDF and ePub downloads, according to the available data) and Abstracts Views on Vision4Press platform.
Data correspond to usage on the plateform after 2015. The current usage metrics is available 48-96 hours after online publication and is updated daily on week days.
Initial download of the metrics may take a while.


