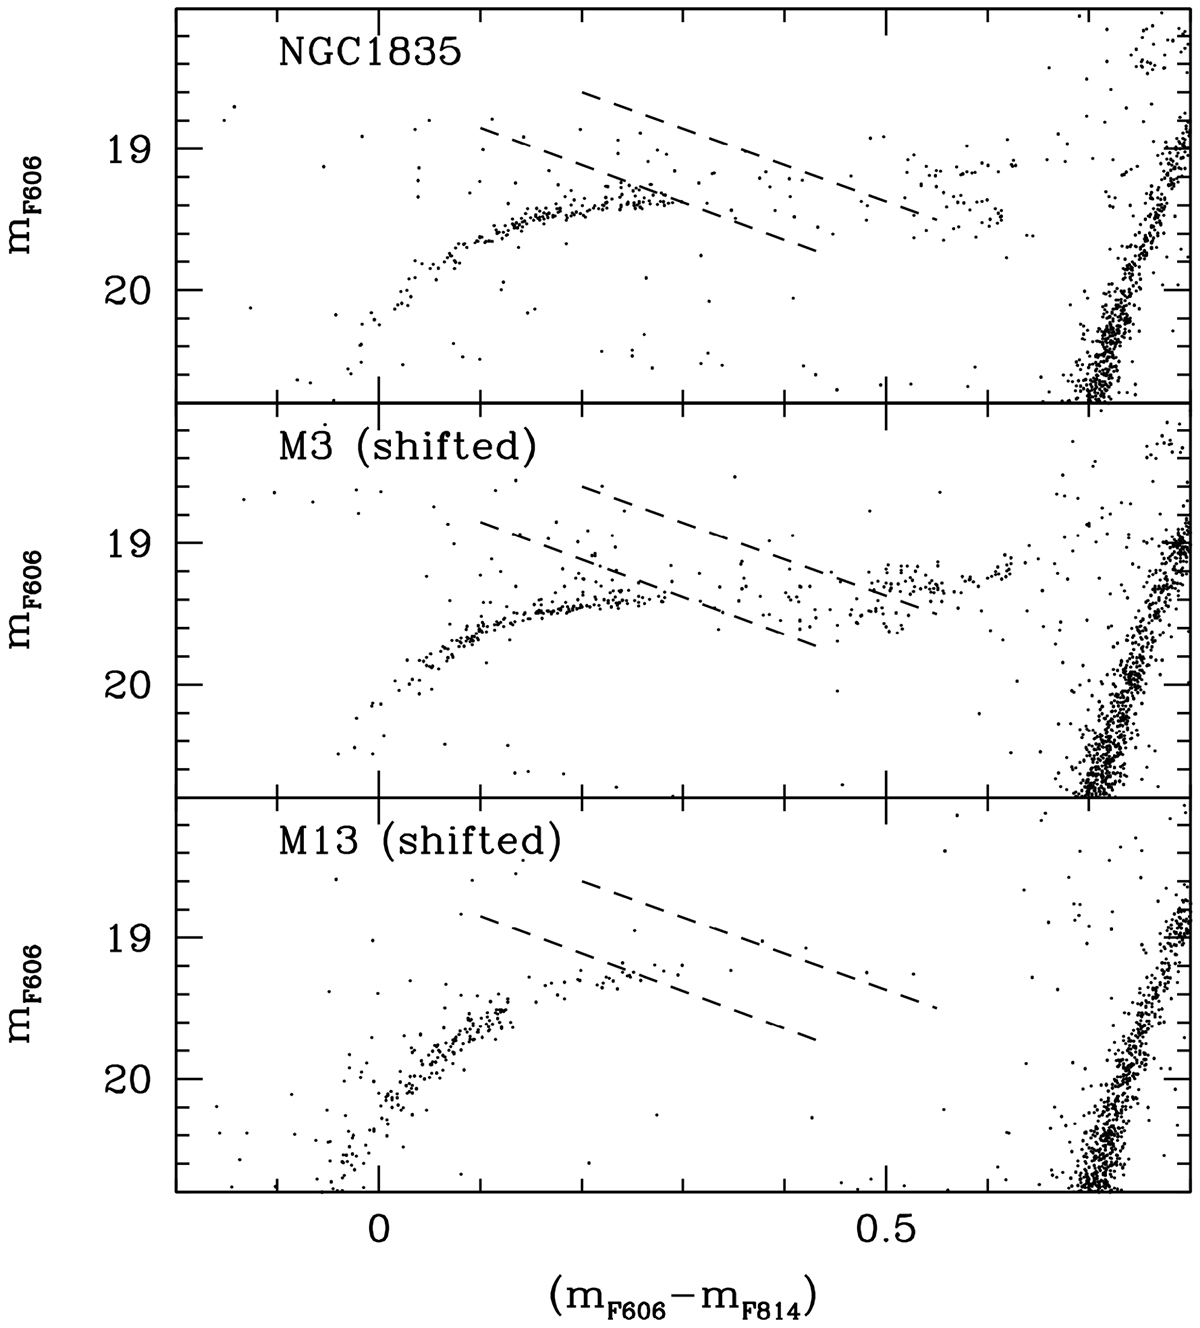
Fig. 7.
Download original image
Low-temperature portion of the HB of NGC 1835 (top panel) compared with those of M 3 (central panel) and M 13 (bottom panel). The CMD of M 3 and M 13 have been shifted to the same distance and reddening of NGC 1835. In all panels, the two dashed lines delimitate the region where most of the RR Lyrae observed at random phases are expected to be located.
Current usage metrics show cumulative count of Article Views (full-text article views including HTML views, PDF and ePub downloads, according to the available data) and Abstracts Views on Vision4Press platform.
Data correspond to usage on the plateform after 2015. The current usage metrics is available 48-96 hours after online publication and is updated daily on week days.
Initial download of the metrics may take a while.