Fig. 7
Download original image
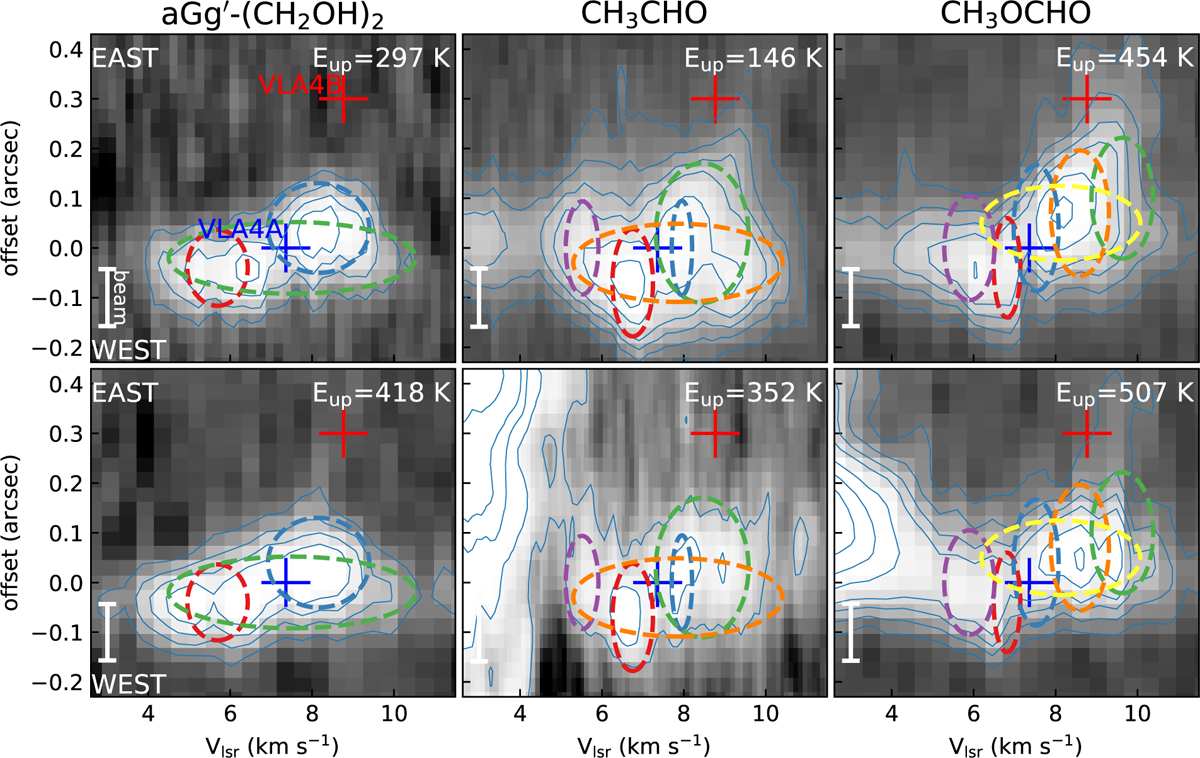
PV diagrams of aGg’-(CH2OH)2, CH3CHO, and CH3OCHO from high-angular-resolution ALMA data (Diaz-Rodriguez et al. 2022). The dashed colored ellipses represent each kinematic component from the best-fit model (with the same colors as Fig. 6). The blue and red crosses indicate the positions and velocities of VLA4A and VLA4B, respectively. The white bar in the lower-left corner shows the beam size along the PV cut. NOEMA fits on top of the higher-resolution ALMA data match the structure, validating the NOEMA fit results.
Current usage metrics show cumulative count of Article Views (full-text article views including HTML views, PDF and ePub downloads, according to the available data) and Abstracts Views on Vision4Press platform.
Data correspond to usage on the plateform after 2015. The current usage metrics is available 48-96 hours after online publication and is updated daily on week days.
Initial download of the metrics may take a while.