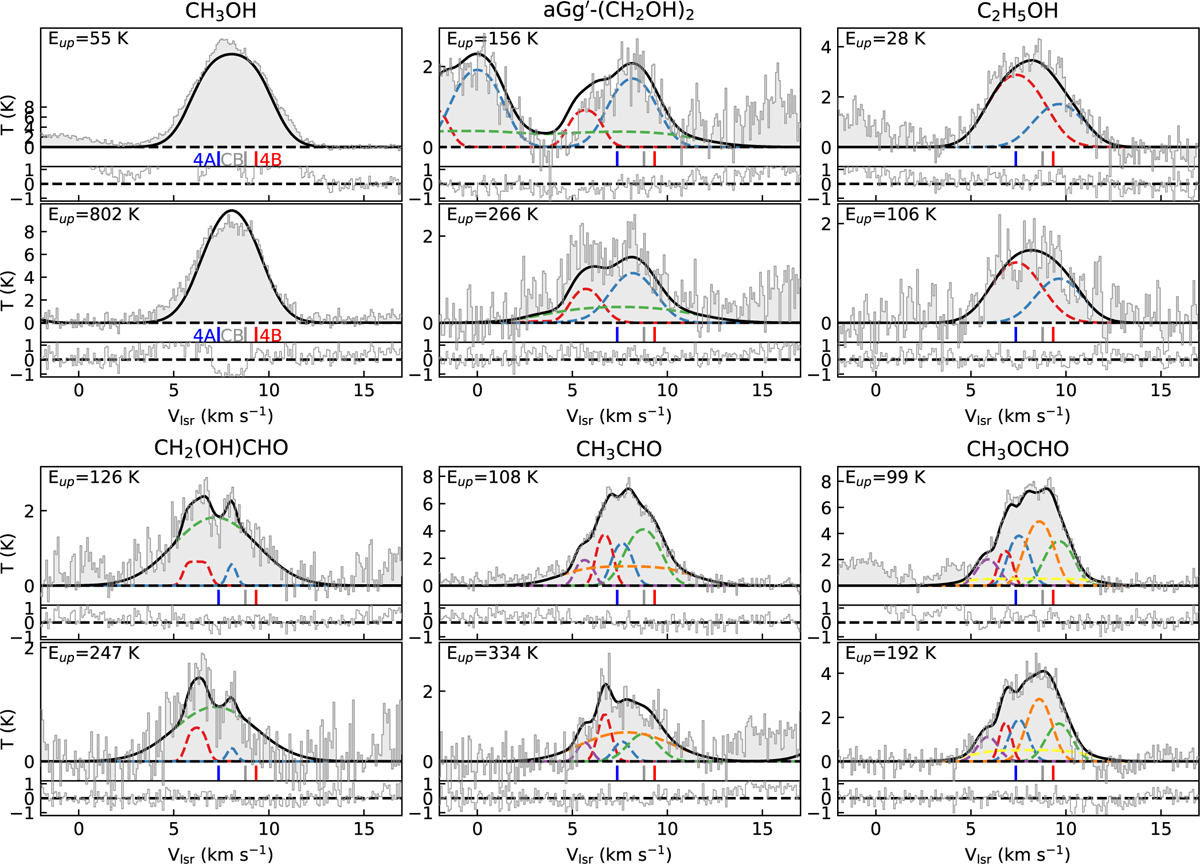
Fig. 6
Download original image
Spectral profiles of two selected transitions for each O-bearing COM. The black curve shows the best-fit model with multiple kinematic components, and the colored dashed lines represent the contribution from each component. The blue, red, and gray bars at the bottom indicate the systemic velocities of VLA4A, VLA4B, and the circumbinary disk, respectively. The insets at the bottom of each panel show the residual from the best-fit model.
Current usage metrics show cumulative count of Article Views (full-text article views including HTML views, PDF and ePub downloads, according to the available data) and Abstracts Views on Vision4Press platform.
Data correspond to usage on the plateform after 2015. The current usage metrics is available 48-96 hours after online publication and is updated daily on week days.
Initial download of the metrics may take a while.