Fig. 5
Download original image
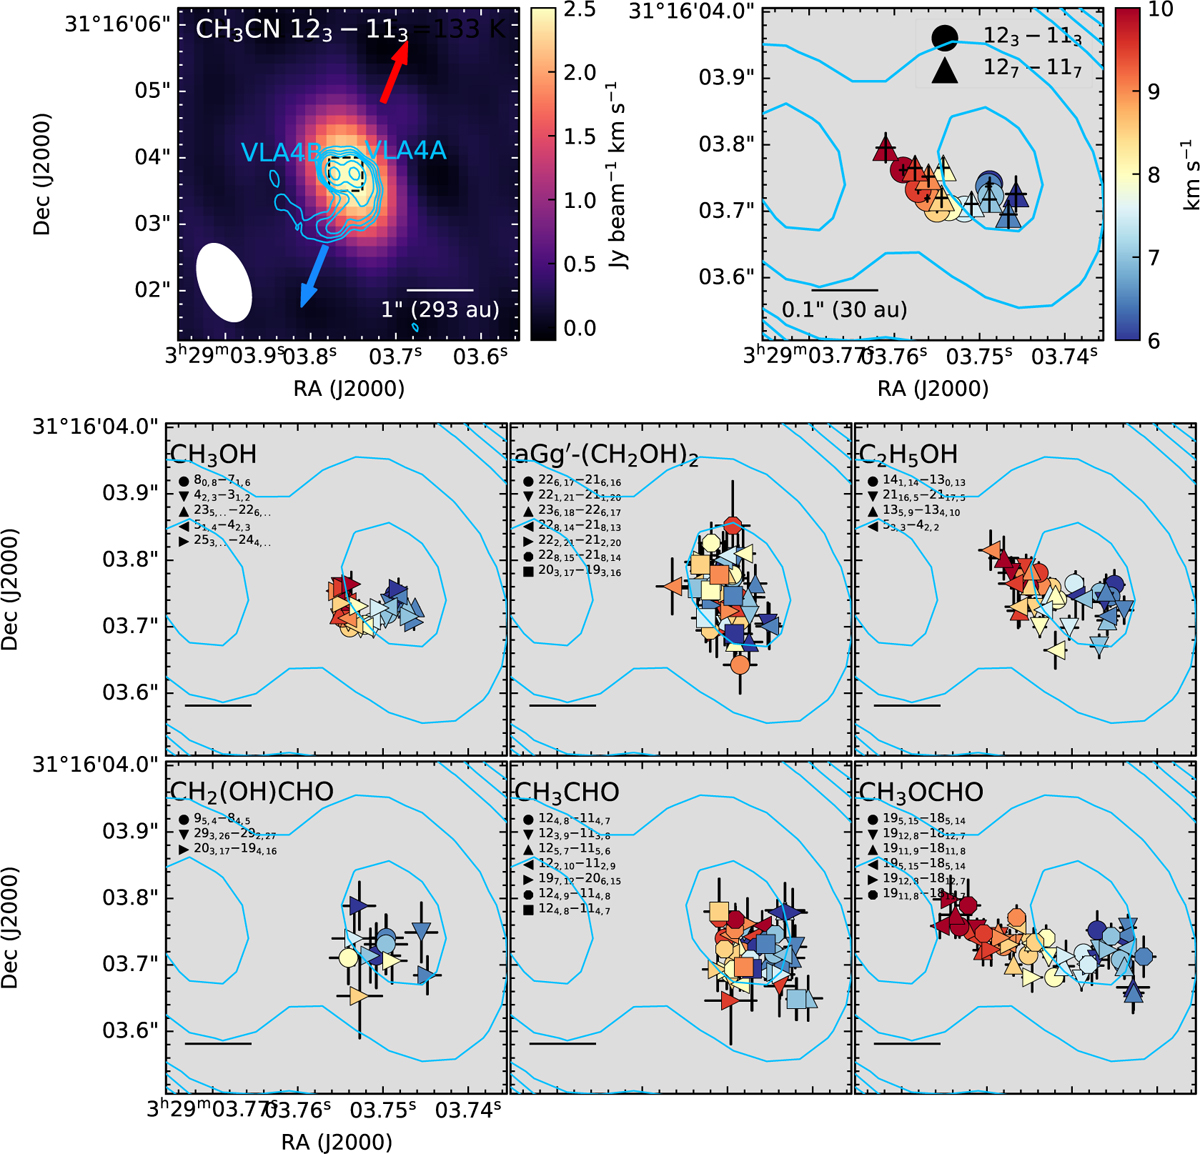
Central positions of selected COM transitions at different velocities. The top two panels show the integrated intensity map (left) and central positions (right) from CH3CN (Hsieh et al. 2023) as a reference for the O-bearing COMs. The contours show the 1.3 mm continuum emission from Tobin et al. (2018). Different line transitions are marked with different symbols (Tables B.1-B.6). The scale bar is 0.″1 for the bottom six panels. The beam sizes for these COM emissions depend on the line frequency but are the same as that of CH3CN (1.″2 × 077) within 10%.
Current usage metrics show cumulative count of Article Views (full-text article views including HTML views, PDF and ePub downloads, according to the available data) and Abstracts Views on Vision4Press platform.
Data correspond to usage on the plateform after 2015. The current usage metrics is available 48-96 hours after online publication and is updated daily on week days.
Initial download of the metrics may take a while.