Open Access
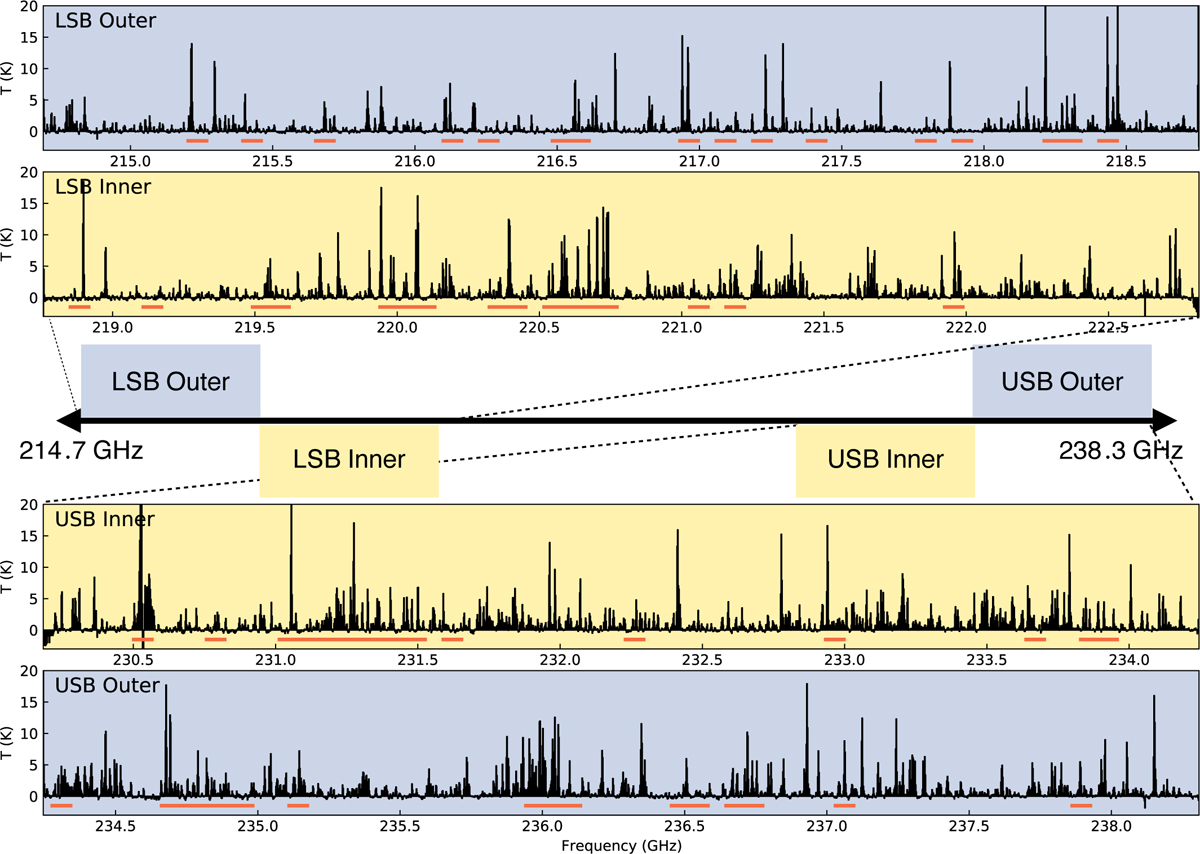
Fig. 2
Download original image
Low-spectral-resolution spectrum toward the continuum peak of SVS13A from the PRODIGE NOEMA large program. The panels, from top to bottom, represent the spectra from the receiver bands as shown in the sketch in the middle. The horizontal orange bars represent locations of the high-spectral-resolution windows.
Current usage metrics show cumulative count of Article Views (full-text article views including HTML views, PDF and ePub downloads, according to the available data) and Abstracts Views on Vision4Press platform.
Data correspond to usage on the plateform after 2015. The current usage metrics is available 48-96 hours after online publication and is updated daily on week days.
Initial download of the metrics may take a while.