Open Access
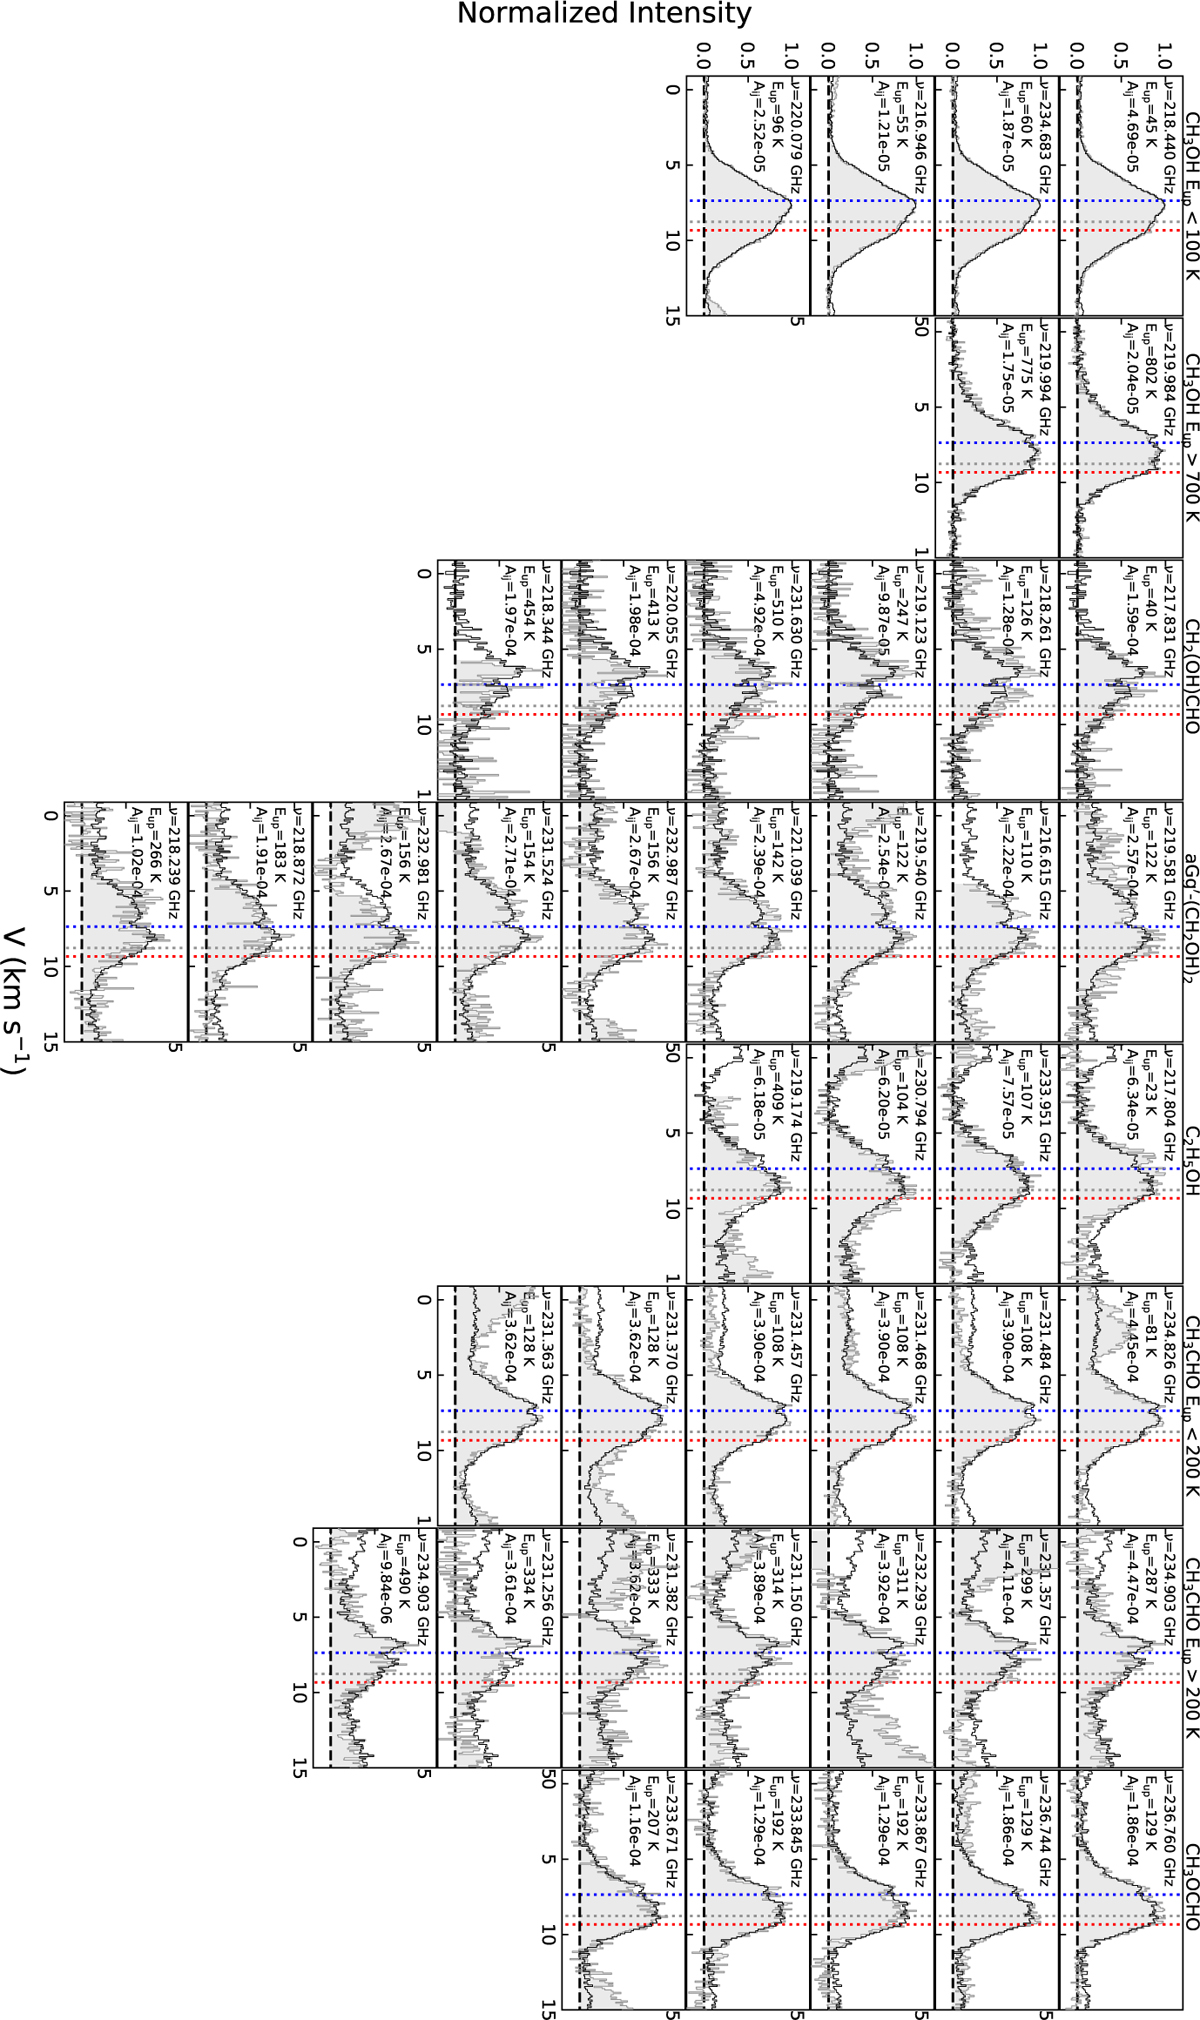
Fig. A.1
Download original image
All spectral profiles used for the line stacking. Each column shows all the transitions of a particular species used in the line stacking, as gray-filled histograms. The black histograms represent the resulting stacked spectrum of each molecule, for comparison.
Current usage metrics show cumulative count of Article Views (full-text article views including HTML views, PDF and ePub downloads, according to the available data) and Abstracts Views on Vision4Press platform.
Data correspond to usage on the plateform after 2015. The current usage metrics is available 48-96 hours after online publication and is updated daily on week days.
Initial download of the metrics may take a while.