Fig. 1
Download original image
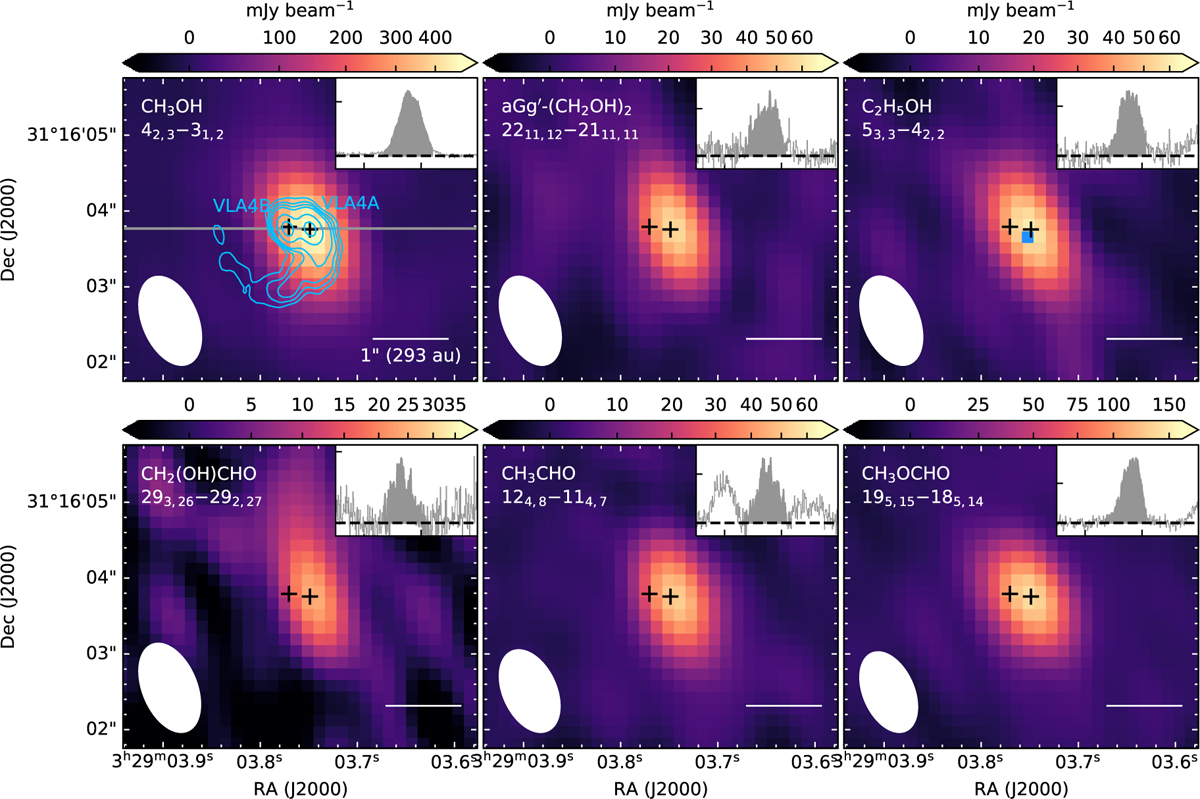
Integrated intensity maps of a selected transition for each O-bearing COM. The top-right panel in each figure shows the spectra toward the center, and the filled regions indicate the integration range for the zero-order moment maps, which is 3.5–10.7 km s−1 (except for CH3OH, for which it is 3.5–12.0 km s−1), for the zero-order moment maps. The blue contours in the top-left panel represent the ALMA 1.3 mm continuum emission (Tobin et al. 2018) with levels of [3, 5, 7, 10, 30, 70]σ. The horizontal gray line in the top-left panel shows the PV cut used in Fig. 7. The blue pixel in the top-right panel is the pixel used to extract the spectra in this work.
Current usage metrics show cumulative count of Article Views (full-text article views including HTML views, PDF and ePub downloads, according to the available data) and Abstracts Views on Vision4Press platform.
Data correspond to usage on the plateform after 2015. The current usage metrics is available 48-96 hours after online publication and is updated daily on week days.
Initial download of the metrics may take a while.