Fig. 8.
Download original image
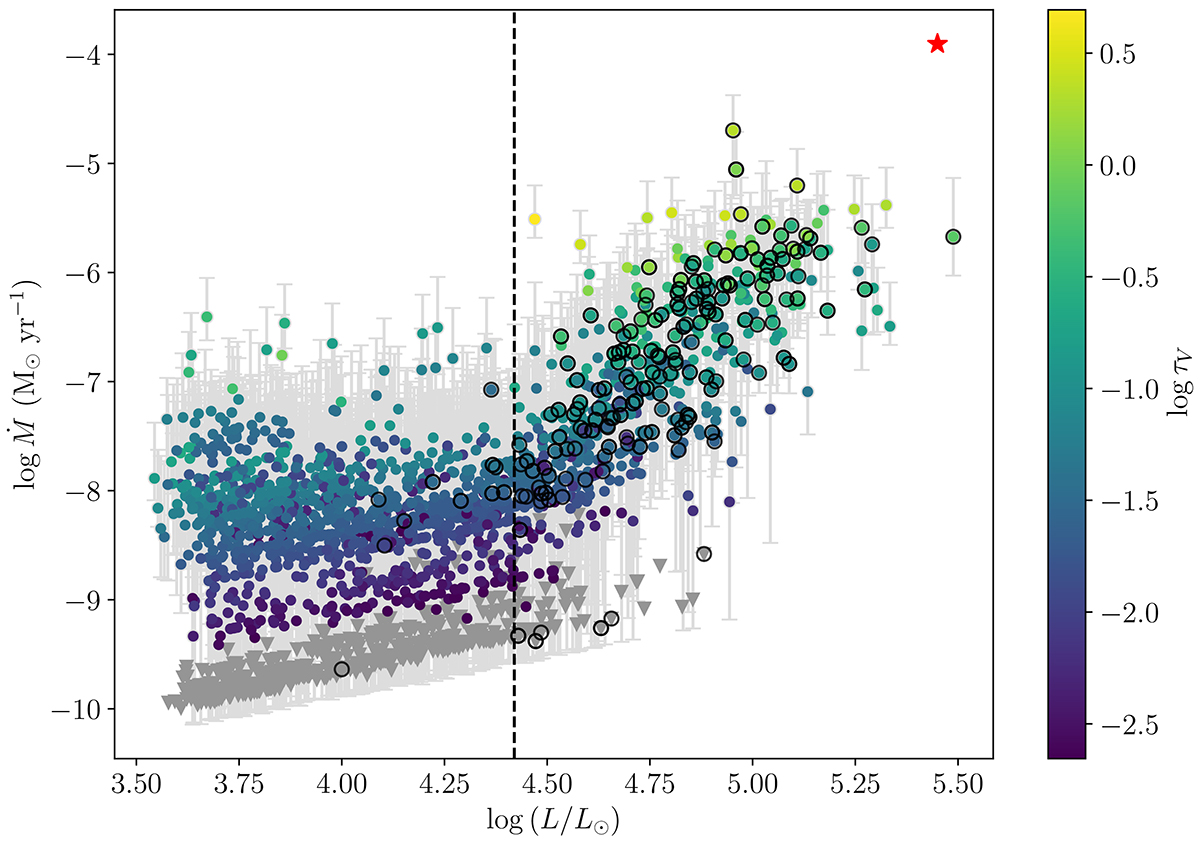
Derived mass-loss rate as a function of the luminosity of each RSG candidate in the LMC. The colour bar shows the best-fit τV. The grey triangles represent the upper limits of targets fitted with the lowest values of the optical depth grid, and the open circles indicate the RSGs with spectral classifications. The dust-enshrouded RSG, WOH G64, is labelled with a red star. The position of the kink is shown with a dashed vertical line at log(L/L⊙) = 4.42.
Current usage metrics show cumulative count of Article Views (full-text article views including HTML views, PDF and ePub downloads, according to the available data) and Abstracts Views on Vision4Press platform.
Data correspond to usage on the plateform after 2015. The current usage metrics is available 48-96 hours after online publication and is updated daily on week days.
Initial download of the metrics may take a while.