Fig. 6.
Download original image
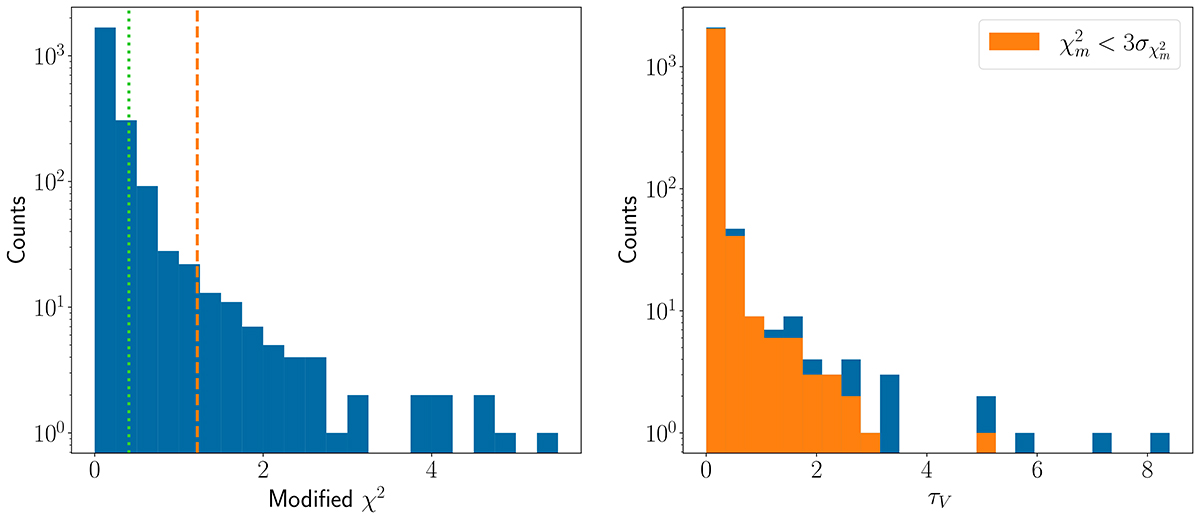
Distributions of SED fitting parameters. Left: distribution of the minimum ![]() . The vertical lines show the σχ2 (green dotted) and the 3σχ2 (dashed orange) limits. Right: distribution of the best-fit optical depth, τV. Orange indicates τV from models with
. The vertical lines show the σχ2 (green dotted) and the 3σχ2 (dashed orange) limits. Right: distribution of the best-fit optical depth, τV. Orange indicates τV from models with ![]() .
.
Current usage metrics show cumulative count of Article Views (full-text article views including HTML views, PDF and ePub downloads, according to the available data) and Abstracts Views on Vision4Press platform.
Data correspond to usage on the plateform after 2015. The current usage metrics is available 48-96 hours after online publication and is updated daily on week days.
Initial download of the metrics may take a while.