Fig. 5.
Download original image
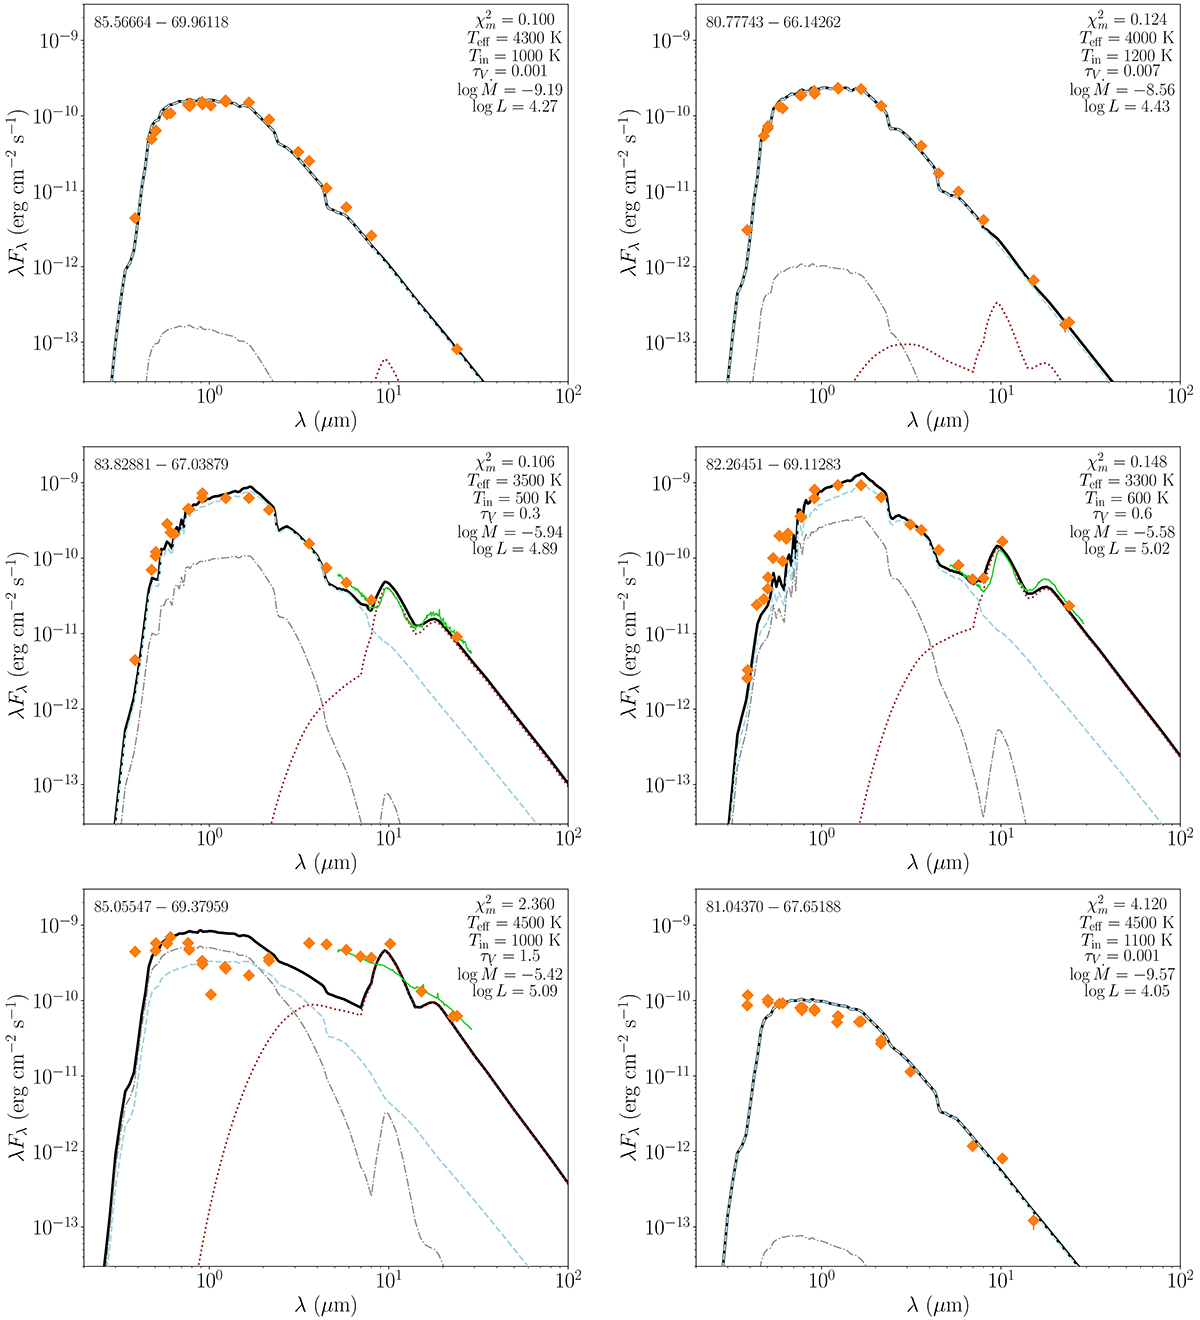
Examples of SED fits of two optically thin (top row), two dusty (middle), and two peculiar (bottom row) RSGs. The orange diamonds show the observations, and the black line is the best-fit model consisting of the attenuated flux (dashed light blue), the scattered flux (dot-dashed grey) and dust emission (dotted brown). The green curve represents the Spitzer IRS spectrum. The coordinates of each source are shown in the top left corner.
Current usage metrics show cumulative count of Article Views (full-text article views including HTML views, PDF and ePub downloads, according to the available data) and Abstracts Views on Vision4Press platform.
Data correspond to usage on the plateform after 2015. The current usage metrics is available 48-96 hours after online publication and is updated daily on week days.
Initial download of the metrics may take a while.