Fig. 2.
Download original image
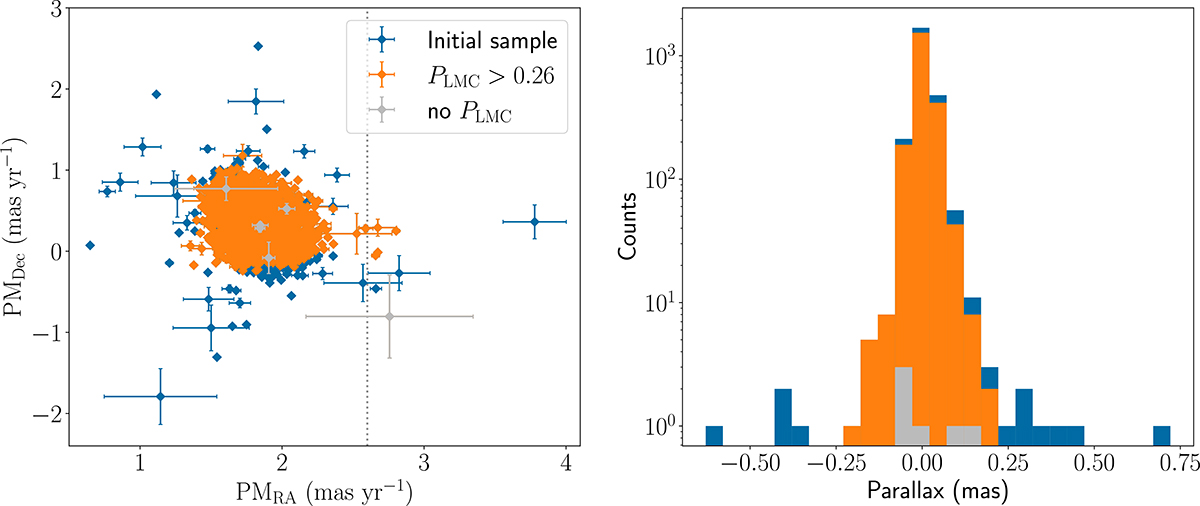
Proper motions in Dec and RA (left) and distribution of parallaxes (right). The blue points show the initial RSG sample, and the orange points show the LMC members after applying the probability criteria from Jiménez-Arranz et al. (2023) with PLMC > 0.26. The grey points indicate sources without a probability measurement from Jiménez-Arranz et al. (2023). Sources located right of the dotted vertical line were considered to be foreground.
Current usage metrics show cumulative count of Article Views (full-text article views including HTML views, PDF and ePub downloads, according to the available data) and Abstracts Views on Vision4Press platform.
Data correspond to usage on the plateform after 2015. The current usage metrics is available 48-96 hours after online publication and is updated daily on week days.
Initial download of the metrics may take a while.