Fig. 10.
Download original image
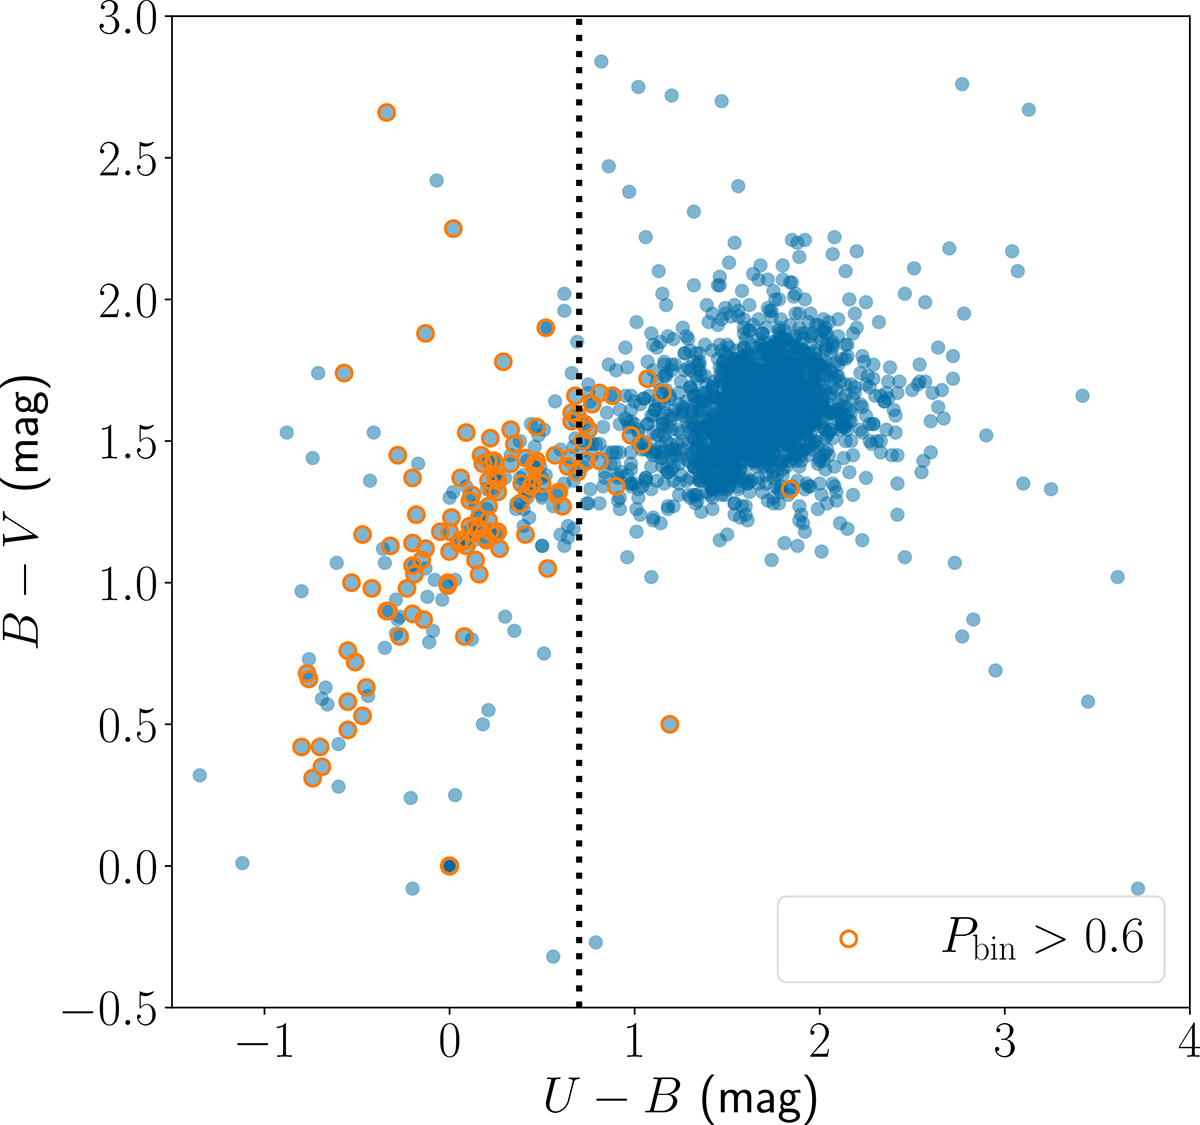
Colour-colour diagram of U − B and B − V. The blue points show all sources with UBV photometry. The orange circles indicate RSGs from Neugent et al. (2020) with a probability of an OB companion Pbin > 0.6. The vertical dotted line corresponds to the limit applied to separate probable binary from single RSG.
Current usage metrics show cumulative count of Article Views (full-text article views including HTML views, PDF and ePub downloads, according to the available data) and Abstracts Views on Vision4Press platform.
Data correspond to usage on the plateform after 2015. The current usage metrics is available 48-96 hours after online publication and is updated daily on week days.
Initial download of the metrics may take a while.