Fig. 1.
Download original image
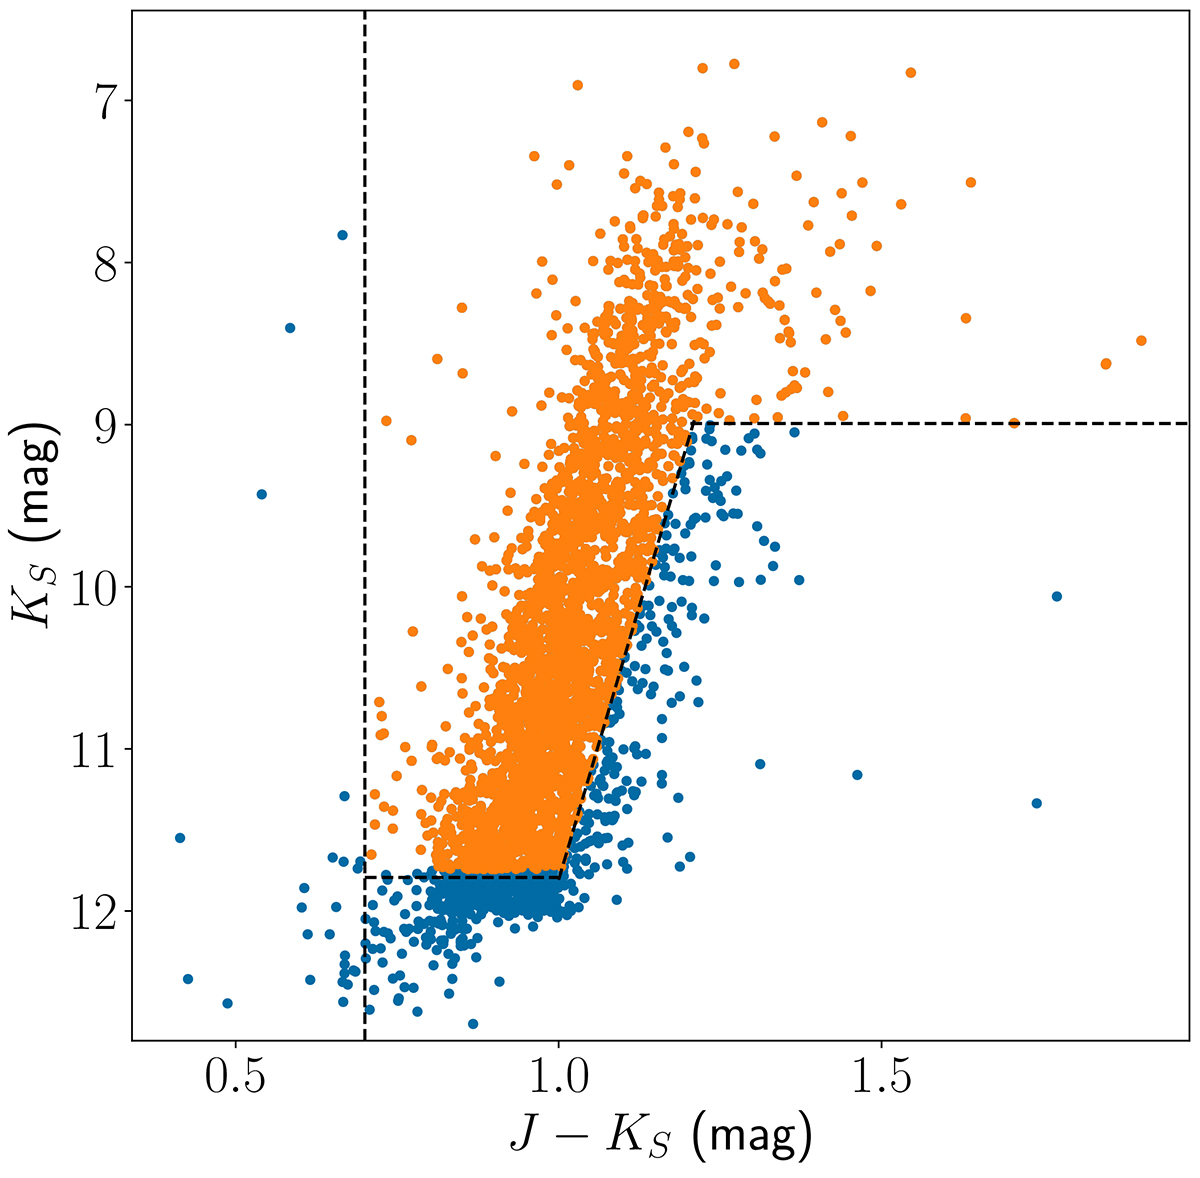
Colour-magnitude diagram (CMD) of the RSGs in the LMC using 2MASS photometric data. The dashed lines define the photometric RSG limits from Yang et al. (2021), modified by increasing the slope of the right diagonal line. The orange points show the sources we kept in our final sample.
Current usage metrics show cumulative count of Article Views (full-text article views including HTML views, PDF and ePub downloads, according to the available data) and Abstracts Views on Vision4Press platform.
Data correspond to usage on the plateform after 2015. The current usage metrics is available 48-96 hours after online publication and is updated daily on week days.
Initial download of the metrics may take a while.