Fig. 9
Download original image
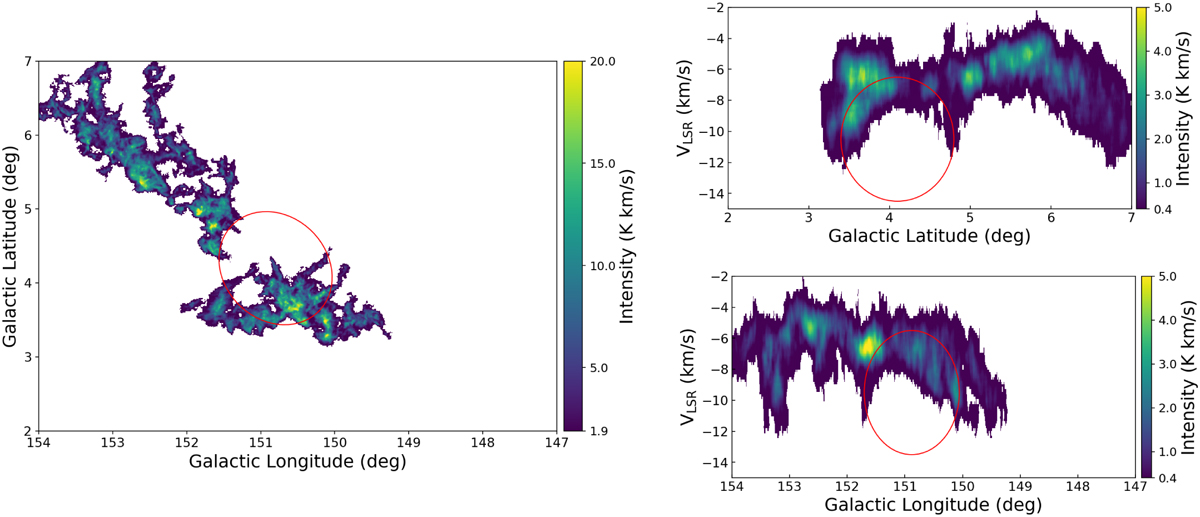
Kinematic analysis of the ambient molecular clouds. Left panel: integrated intensity images for clouds: MC G150.6+03.7, MC G149.5+04.9, MC G151.9+05.2, and MC 150.9+05.1. Right panels: l-v (top) and b-v (bottom) diagrams show the 12CO data integrated over the selected clouds. An approximate fitting is marked by a red solid-line ellipse, illustrating an arc-like structure in the diagrams.
Current usage metrics show cumulative count of Article Views (full-text article views including HTML views, PDF and ePub downloads, according to the available data) and Abstracts Views on Vision4Press platform.
Data correspond to usage on the plateform after 2015. The current usage metrics is available 48-96 hours after online publication and is updated daily on week days.
Initial download of the metrics may take a while.