Open Access
Fig. 8
Download original image
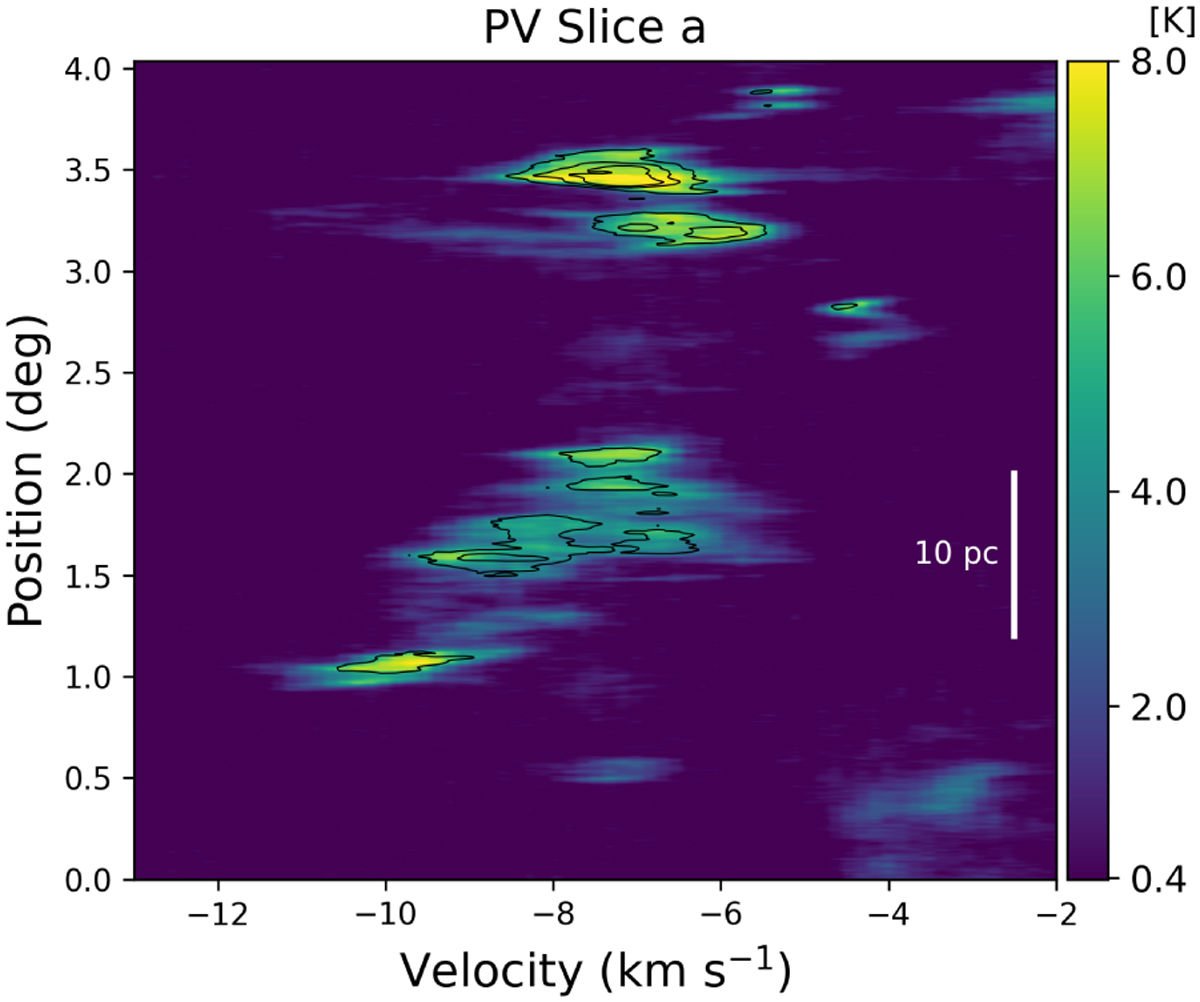
Position-velocity map of 12CO along the direction marked in Fig. 6. The contour shows the 13CO emission with the contour level of [1.3,2.6,3.9] K (lσ = 0.13 K), while the background shows the 12CO emission.
Current usage metrics show cumulative count of Article Views (full-text article views including HTML views, PDF and ePub downloads, according to the available data) and Abstracts Views on Vision4Press platform.
Data correspond to usage on the plateform after 2015. The current usage metrics is available 48-96 hours after online publication and is updated daily on week days.
Initial download of the metrics may take a while.