Fig. 7
Download original image
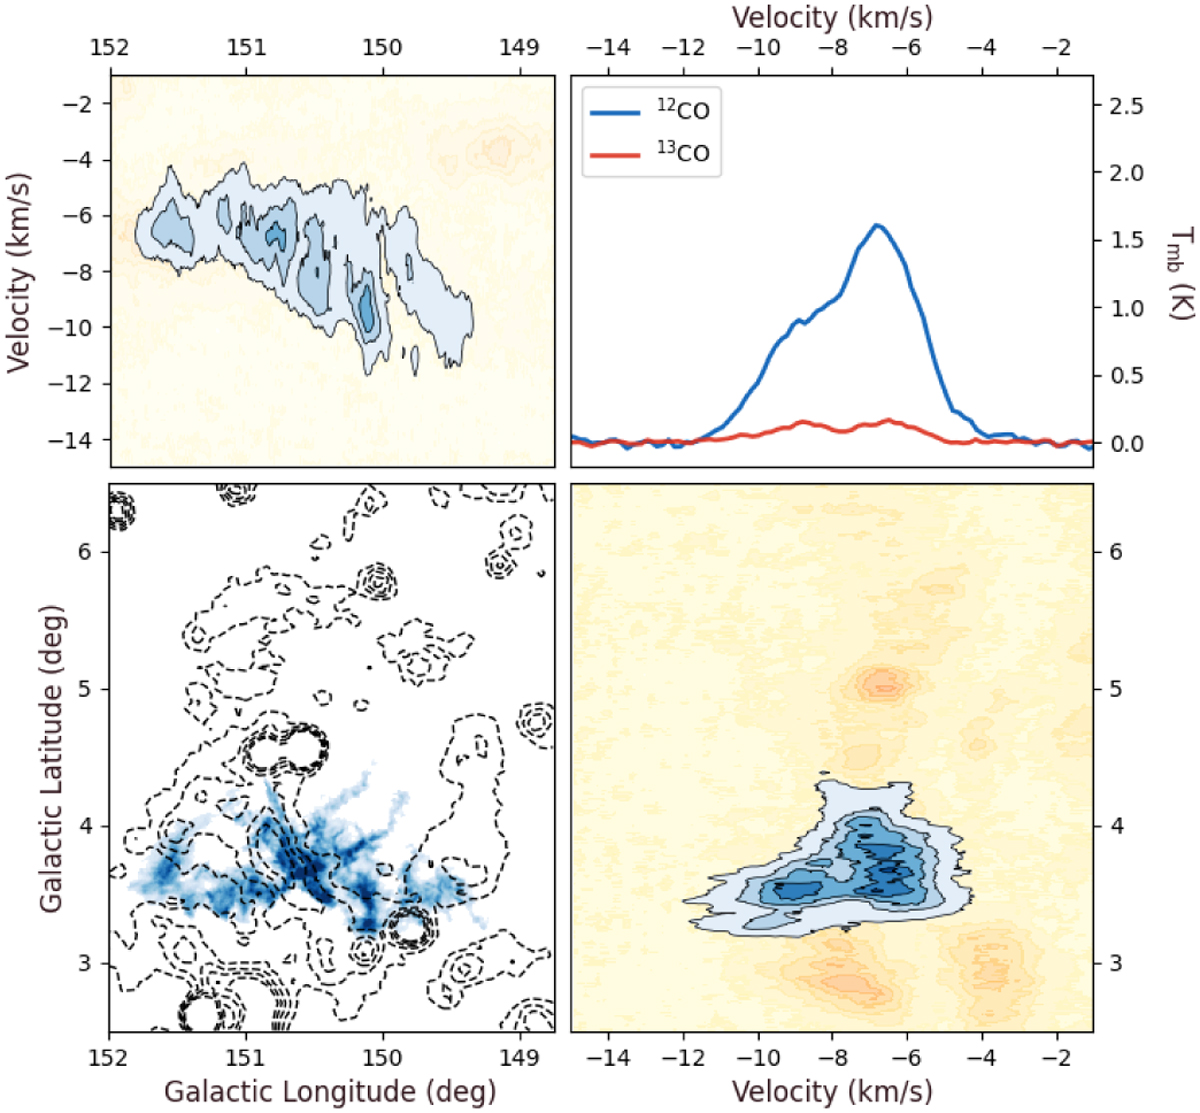
Velocity-spatial structures and CO spectra of MC G150.6+03.7. Lower-left: velocity-integrated intensity image of MC G150.6+03.7 masked by DBSCAN shown with the blue-filled contour with the contour level of [0.66, 4.62, 8.58, 12.54, 16.5, 20.46, 24.42] K km s−1 , and the black dashed contour is the Urumqi λ 6 cm radio emission with the same contour level as in Fig. 2. Lower-right: latitude–velocity diagram of the whole area (yellow-filled contour) and MC G150.6+03.7 (blue-filled contour). The yellow-filled contour level is [−0.5, 0.2, 1.2, 2.2, 3.2, 4.2, 5.2, 6.2, 7.2, 8.2, 9.2, 12] K, and the blue-filled contour level is [0.2, 1.2, 2.2, 3.2, 4.2, 5.2] K. Upper-left: longitude–velocity diagram with the same colour and level setting as the latitude–velocity diagram. Upper-right: average 12CO (blue) and 13CO (red) spectra extracted from the MC G150.6+03.7 region.
Current usage metrics show cumulative count of Article Views (full-text article views including HTML views, PDF and ePub downloads, according to the available data) and Abstracts Views on Vision4Press platform.
Data correspond to usage on the plateform after 2015. The current usage metrics is available 48-96 hours after online publication and is updated daily on week days.
Initial download of the metrics may take a while.