Open Access
Fig. 5
Download original image
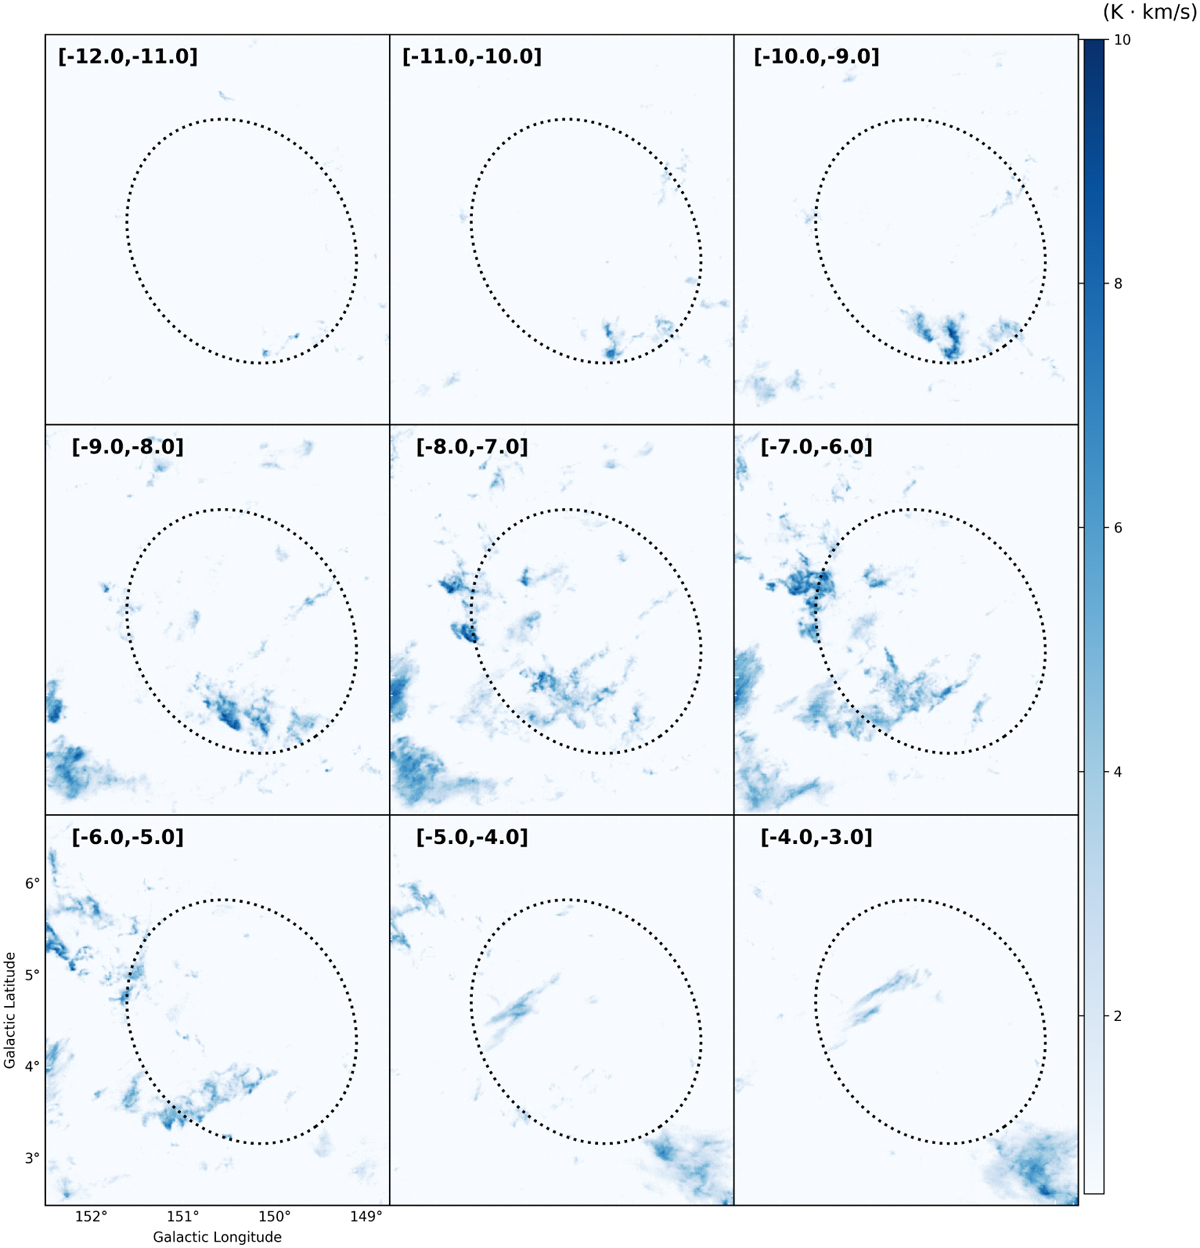
12CO emission channel maps integrated over each 1 km s−1 (3σ = 0.54 K km s−1). The velocity range (in km s−1) is indicated in the top left corner of each panel. The dotted ellipse shows the size of the remnant in the Urumqi λ 6 cm radio observations.
Current usage metrics show cumulative count of Article Views (full-text article views including HTML views, PDF and ePub downloads, according to the available data) and Abstracts Views on Vision4Press platform.
Data correspond to usage on the plateform after 2015. The current usage metrics is available 48-96 hours after online publication and is updated daily on week days.
Initial download of the metrics may take a while.