Fig. 3
Download original image
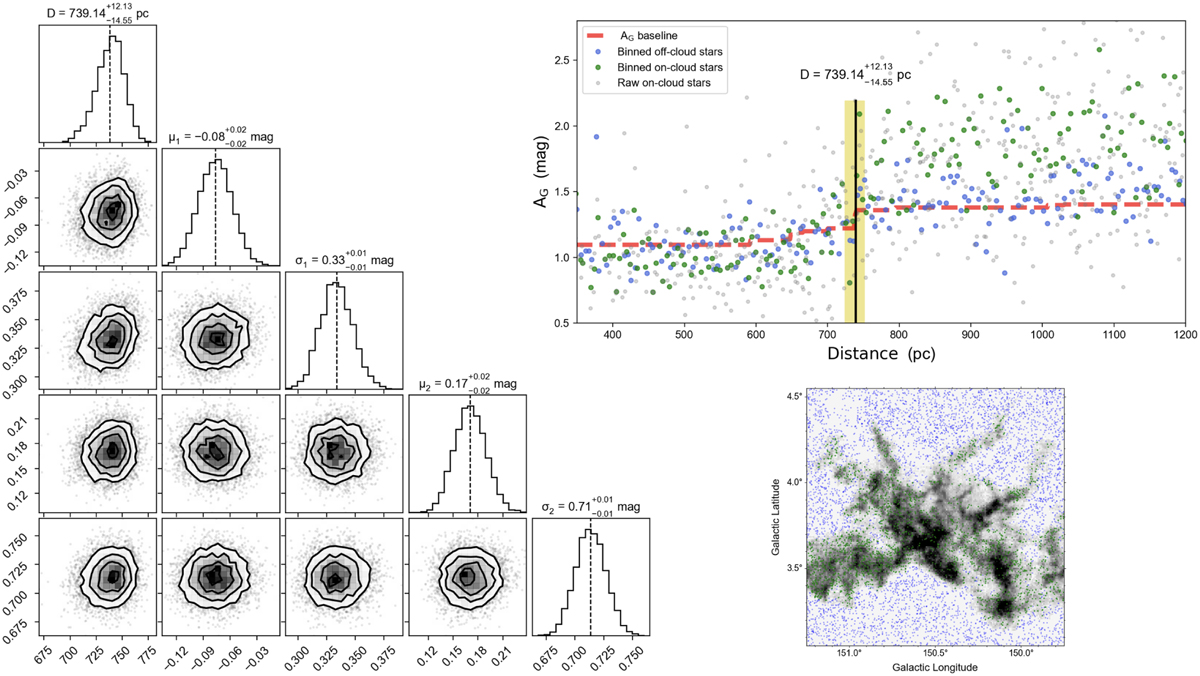
Distance of the southern molecular clouds. The bottom-right panel shows the CO velocity-integrated intensity images. In the top-right panels, the green and blue points present on- and off-cloud stars (binned every 5 pc), respectively. The dashed red lines show the modeled extinction AG. The distances were derived with raw on-cloud Gaia DR3 stars, which are represented with gray points. The black vertical lines indicate the distance (D) estimated with Bayesian analyses and Markov chain Monte Carlo sampling, and the shadow areas depict the 95% highest posterior density range of distances. The corner plots of the MCMC samples are displayed on the left. The mean of the samples is shown with solid lines, and the systematic uncertainty is not included. The distance of the southern molecular cloud is measured to be ![]() pc.
pc.
Current usage metrics show cumulative count of Article Views (full-text article views including HTML views, PDF and ePub downloads, according to the available data) and Abstracts Views on Vision4Press platform.
Data correspond to usage on the plateform after 2015. The current usage metrics is available 48-96 hours after online publication and is updated daily on week days.
Initial download of the metrics may take a while.