Fig. 2
Download original image
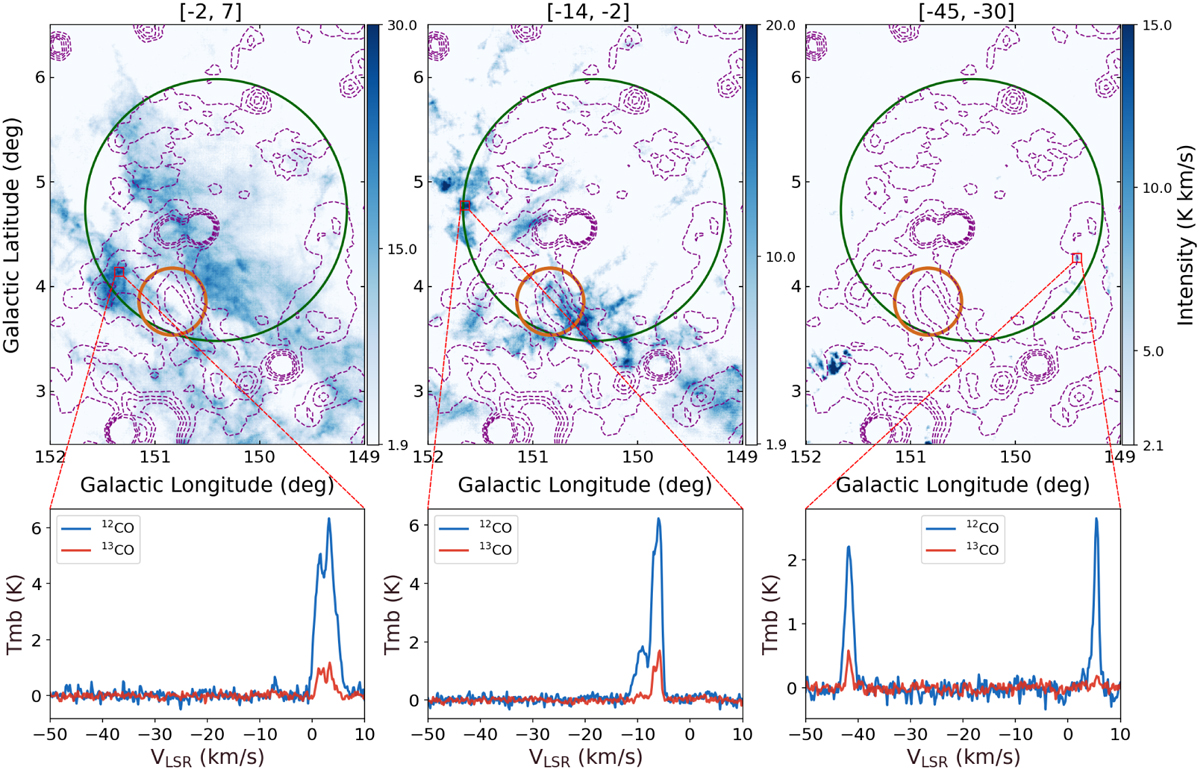
Velocity-integrated intensity image with typical spectra over three individual velocity ranges, left: [−2, 7], middle: [−14, −2], and right: [−45, −30] km s−1. The top panel of each image displays intensity maps derived from CO observations. The color scale ranges from 3σ, as indicated on the color bar. The purple dashed contours represent Urumqi λ 6 cm radio continuum emission, as in Fig. 1. The orange and green circles represent the LHAASO source 1LHAASO J0428+5531, with orange indicating KM2A components and green denoting WCDA components. The lower panel shows the average spectra for the highlighted region, where the blue and red spectra represent 12CO and 13CO, respectively.
Current usage metrics show cumulative count of Article Views (full-text article views including HTML views, PDF and ePub downloads, according to the available data) and Abstracts Views on Vision4Press platform.
Data correspond to usage on the plateform after 2015. The current usage metrics is available 48-96 hours after online publication and is updated daily on week days.
Initial download of the metrics may take a while.