Fig. 12
Download original image
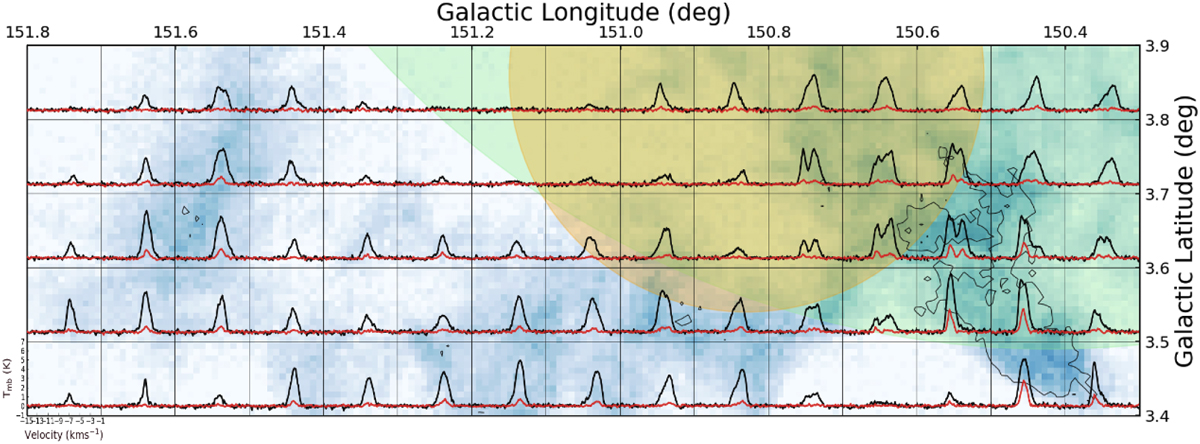
Gridded spectra plot for MC G150.6+03.7. The background shows the intergrated intensity of 12CO emission, while the overlaid spectra of both 12CO (black) and 13CO (red) represent the average spectra for each respective grid area. The green shadow indicates the WCDA component as in Fig. 1, while the yellow shadow area indicates the KD2A component.
Current usage metrics show cumulative count of Article Views (full-text article views including HTML views, PDF and ePub downloads, according to the available data) and Abstracts Views on Vision4Press platform.
Data correspond to usage on the plateform after 2015. The current usage metrics is available 48-96 hours after online publication and is updated daily on week days.
Initial download of the metrics may take a while.