Open Access
Fig. 11
Download original image
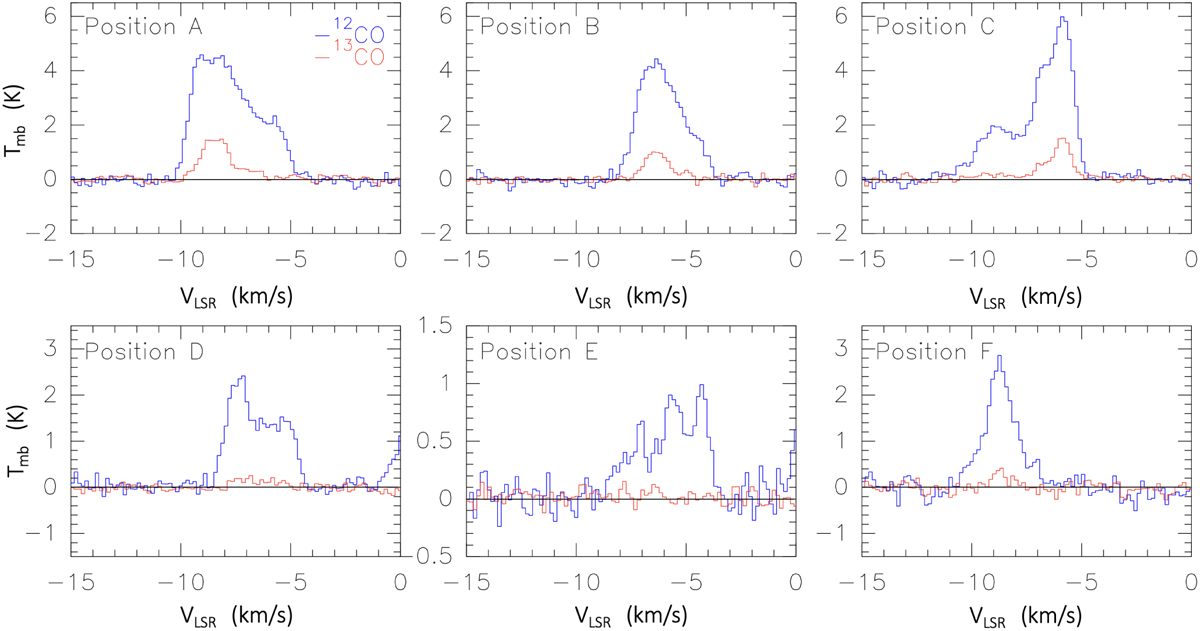
CO spectra in the surrounding clouds of the SNR G150.3+4.5. The spectra are sampled from the six positions marked in Fig. 6, with an area of 1′ × 1′. In each panel, the blue and red spectra represent the emission from the 12CO and13 CO . The spectra all show large velocity dispersion.
Current usage metrics show cumulative count of Article Views (full-text article views including HTML views, PDF and ePub downloads, according to the available data) and Abstracts Views on Vision4Press platform.
Data correspond to usage on the plateform after 2015. The current usage metrics is available 48-96 hours after online publication and is updated daily on week days.
Initial download of the metrics may take a while.