Fig. 10
Download original image
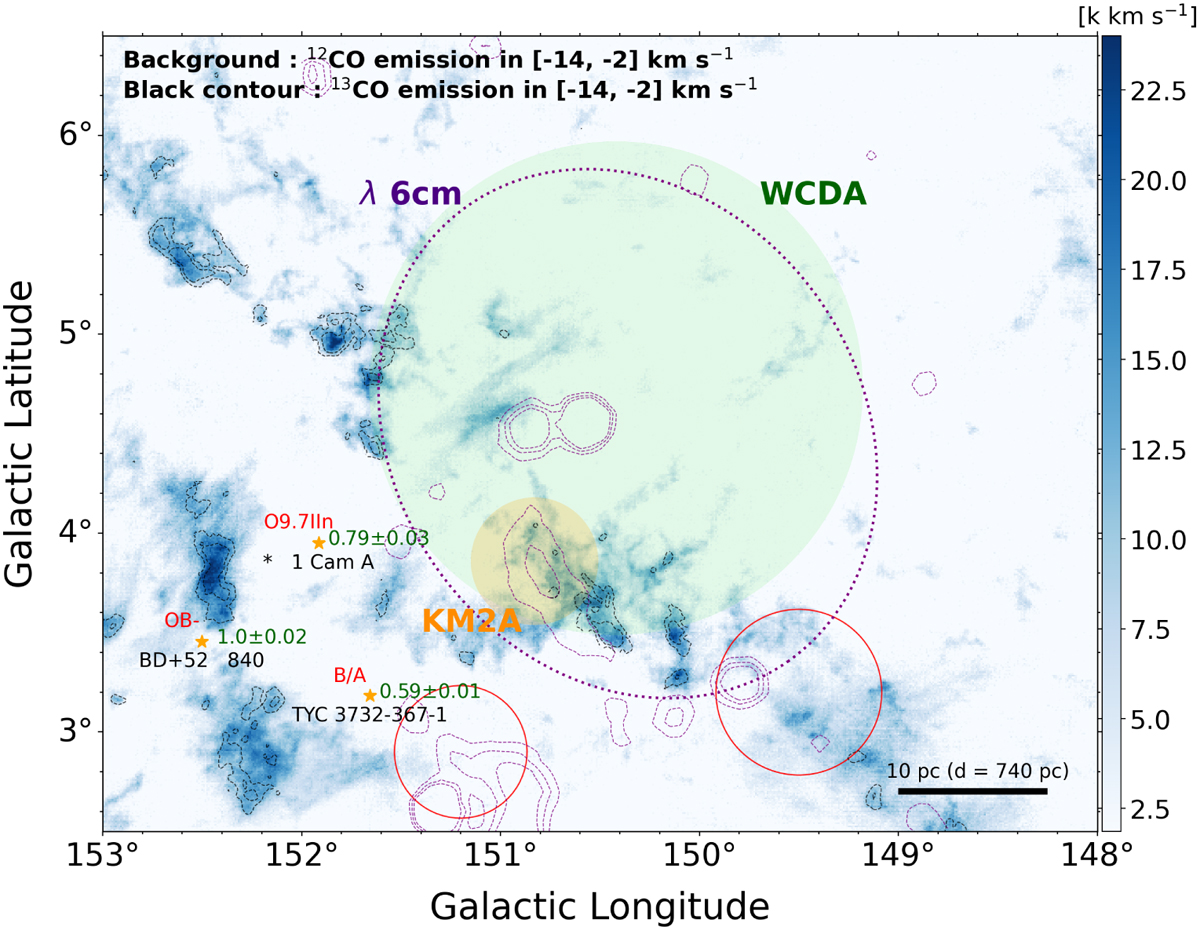
Integrated intensity map of12 CO with the color scale range from 3σ (1.9 K km s−1). The black contour shows the 13CO emission with the contour level of [1.75, 3.5] (5σ = 1.75) K km s−1 . The velocities are both integrated within [−14, −2] km s−1. The purple dashed ellipse and contours show the size and intensity with the contour level of [12, 15, 18] K of Urumqi λ 6 cm radio continuum emission. The orange and green circles represent the LHAASO source 1LHAASO J0428+5531 (Cao et al. 2024), with orange indicating KM2A components and green denoting WCDA components. The CO emission aligns well with the radio shell and is spatially coincident with the LHAASO source. The yellow star markers represent massive OB stars, with the red labels indicating the spectral types and the green labels displaying the distances in kiloparsecs.
Current usage metrics show cumulative count of Article Views (full-text article views including HTML views, PDF and ePub downloads, according to the available data) and Abstracts Views on Vision4Press platform.
Data correspond to usage on the plateform after 2015. The current usage metrics is available 48-96 hours after online publication and is updated daily on week days.
Initial download of the metrics may take a while.