Fig. 1
Download original image
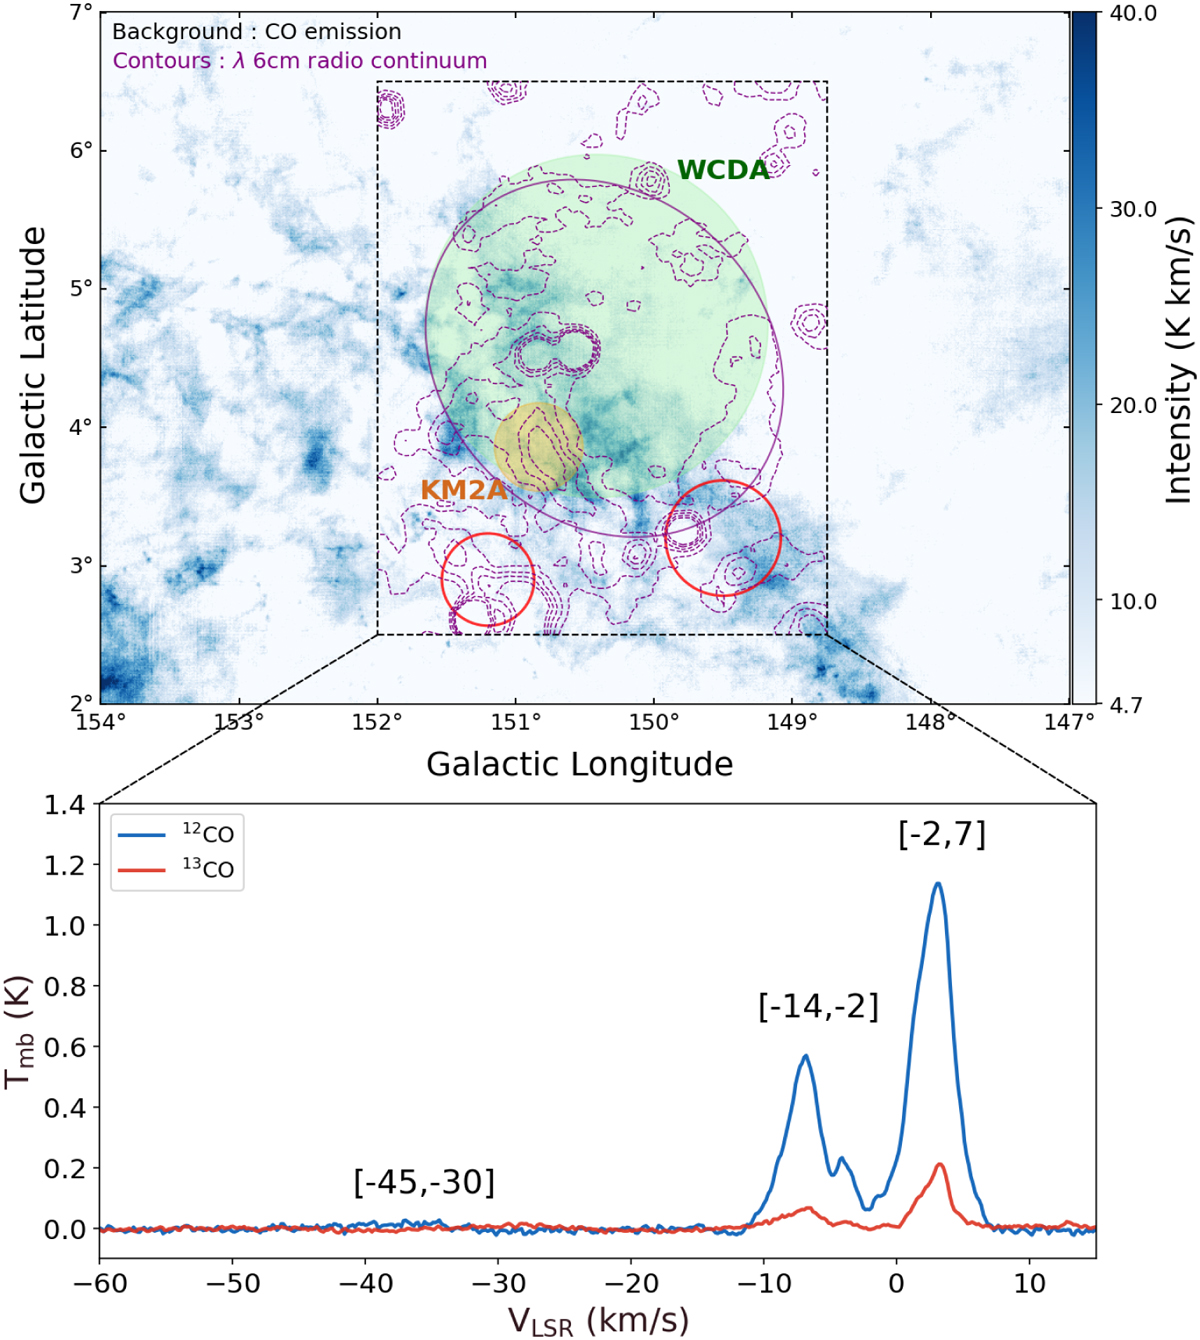
Large-field global view toward SNR G150.3+4.5. The upper panel shows an integrated intensity map derived from the 12CO emission with a velocity range between −60 and 15 km s−1 (3σ = 4.7 K km s−1). The purple dashed contours represent the Urumqi λ 6 cm radio continuum emission (Gao & Han 2014), and the purple ellipse shows the size of the remnant in the 6 cm radio observations. The contours run at 3.0 + n × 3.0 mK (n = 1, 2,… 5). The orange and green circles represent the very high energy source 1LHAASO J0428+5531 (Cao et al. 2024), with orange indicating KM2A component and green denoting the WCDA component. The red circles represent two SNR candidates G151.2+2.9 (Kerton et al. 2007) and G149.5+3.2 (Gerbrandt et al. 2014). The bottom panel depicts the average spectra of the regions marked in the upper panel with the rectangle, with the spectra of 12CO (blue) and 13CO (red). The annotations on the spectra pinpoint the velocity ranges of individual components.
Current usage metrics show cumulative count of Article Views (full-text article views including HTML views, PDF and ePub downloads, according to the available data) and Abstracts Views on Vision4Press platform.
Data correspond to usage on the plateform after 2015. The current usage metrics is available 48-96 hours after online publication and is updated daily on week days.
Initial download of the metrics may take a while.